Tiverton: Fire Incidents, Rhode Island (RI)
Where are fire incidents reported in Tiverton, RI
Something went wrong! Please refresh the page.
|
| |||||||||||||||||||||||||||||||||||||||||||||||||||||||||||||||||||||||||||||||||||||||||||||||||||||||||||||
2008 - 2018 National Fire Incident Reporting System (NFIRS) incidents
- Incident types reported to NFIRS in Tiverton, RI
- 4,55568.4%Rescue & EMS
- 77811.7%False Alarm
- 6049.1%Service Call
- 2113.2%Fire
- 2083.1%Good Intent Call
- 1973.0%Hazardous Condition
- 911.4%Special Incident
- 80.1%Severe Weather
- Fire incident types reported to NFIRS in Tiverton, RI
- 11353.6%Structure Fires
- 6430.3%Outside Fires
- 2210.4%Other
- 125.7%Mobile Property/Vehicle Fires
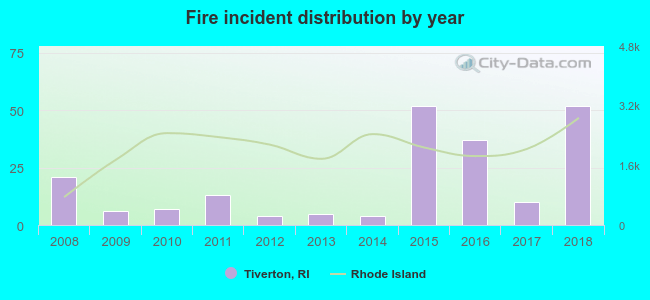 According to the data from the years 2008 - 2018 the average number of fire incidents per year is 19. The highest number of fire incidents - 52 took place in 2015, and the least - 4 in 2012. The data has a growing trend.
The average number of yearly fire incidents per 10k residents in Tiverton, RI compared to nearest cities:
(Note: Based on data for the last 3 years, including only cities with population 5,000 and above)
| Tiverton: | 43.7 |
| Bristol: | 54.8 |
| Portsmouth: | 14.0 |
| Barrington: | 5.4 |
| Middletown: | 27.0 |
| Warwick: | 0.3 |
| Jamestown: | 16.7 |
| Newport: | 19.2 |
| East Providence: | 21.7 |

 32.2% incidents where reported in the morning and 67.8% in the evening. The most fires (16.6%) took place on Monday, and the least (10.9%) on Wednesday.
 According to the 211 incident reports from years 2008 - 2018 most fires (11.8%) took place during January, and the least (5.2%) in October.
 Out of all 6,655 cases reported during the years 2008 - 2018, the most belonged to the categories: Rescue & EMS (68.4%), False Alarm (11.7%), and Service Call (9.1%).
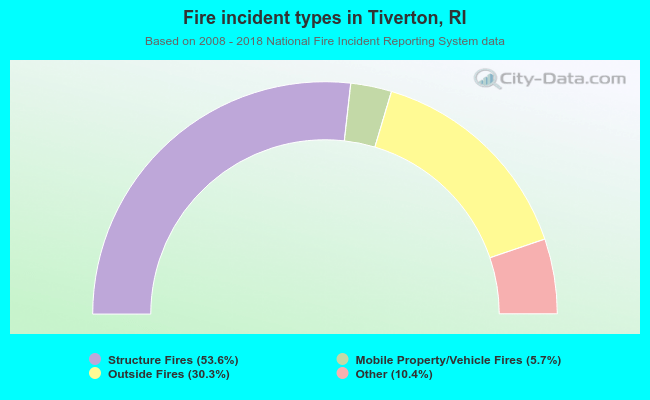 When looking into fire subcategories, the most incidents belonged to: Structure Fires (53.6%), and Outside Fires (30.3%).