Spring Lake: Fire Incidents, North Carolina (NC)
Where are fire incidents reported in Spring Lake, NC
Something went wrong! Please refresh the page.
| Fire incidents reported | |
|---|---|
| Sreet name | Count |
| RAY RD | 262 |
| BRAGG BLVD | 222 |
| LILLINGTON HWY | 174 |
| OVERHILLS RD | 170 |
| NC 210 | 110 |
| MANCHESTER RD | 102 |
| CHAPEL HILL RD | 98 |
| MAIN ST | 94 |
| ELLIOTT BRIDGE RD | 88 |
| VASS RD | 86 |
| AZALEA DR | 76 |
| BETHEL BAPTIST RD | 74 |
| NURSERY RD | 74 |
| SPRING AVE | 72 |
| HWY 210 | 68 |
| BRINKLEY DR | 62 |
| MCLAMB CT | 62 |
| RAINEY DR | 62 |
| MCKAY DR | 56 |
| PINE KNOLL DR | 56 |
| PINE TREE LN | 54 |
| FIRST ST | 50 |
| MCCORMICK RD | 50 |
| SIERRA TRL | 50 |
| SHADY GROVE RD | 48 |
| (NONE) | 46 |
| CONNIE CT | 46 |
| KILLDEER DR | 46 |
| HAYES RD | 44 |
| LAKE AVE | 44 |
| Other | 992 |
2002 - 2018 National Fire Incident Reporting System (NFIRS) incidents
- Incident types reported to NFIRS in Spring Lake, NC
- 6,04437.0%Rescue & EMS
- 3,67022.4%Good Intent Call
- 3,53821.6%Fire
- 1,3508.3%Hazardous Condition
- 9395.7%False Alarm
- 7354.5%Service Call
- 650.4%Severe Weather
- Fire incident types reported to NFIRS in Spring Lake, NC
- 1,93954.8%Structure Fires
- 1,22434.6%Outside Fires
- 2637.4%Mobile Property/Vehicle Fires
- 1123.2%Other
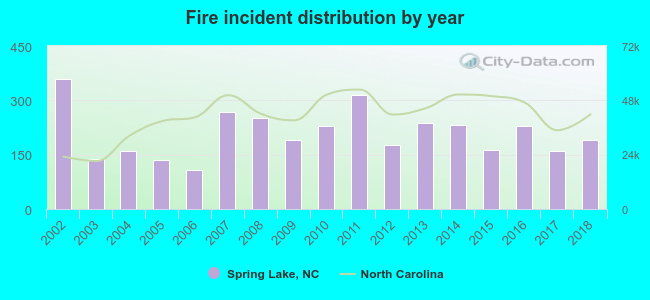 According to the data from the years 2002 - 2018 the average number of fires per year is 208. The highest number of reported fire incidents - 360 took place in 2002, and the least - 107 in 2006. The data has a dropping trend.
The average number of yearly fire incidents per 10k residents in Spring Lake, NC compared to nearest cities:
(Note: Based on data for the last 3 years, including only cities with population 5,000 and above)
| Spring Lake: | 144.1 |
| Fort Bragg: | 0.3 |
| Fayetteville: | 65.8 |
| Hope Mills: | 205.7 |
| Dunn: | 217.0 |
| Sanford: | 128.7 |
| Southern Pines: | 88.4 |
| Aberdeen: | 178.1 |
| Pinehurst: | 47.3 |
 The median response time based on all reported fire incidents is 8 minutes. This is higher compared to the state median value.
The median response time in Spring Lake, NC compared to nearest cities:
(Note: Based on data for all years, including only cities with at least 500 fire incidents)
| Spring Lake: | 8 minutes |
| Fayetteville: | 5 minutes |
| Wade: | 9 minutes |
| Linden: | 10 minutes |
| Bunnlevel: | 9 minutes |
| Hope Mills: | 7 minutes |
| Lillington: | 9 minutes |
| Vass: | 7 minutes |
| Cameron: | 8 minutes |
 Based on the data from the years 2002 - 2018 the average number of fire-related yearly deaths is 0. The highest number of deaths - 1 took place in 2010, and the lowest - 0 in 2002. The data has a growing trend.
The average number of deaths per 1,000 fire incidents is 1. This indicator was the highest - 5 in 2018, and the lowest 0 in 2002. The trend for deaths per 1,000 fire incidents is growing. Compared to the state value the number of deaths per 1,000 fire incidents is lower.
Based on the data from the years 2002 - 2018 the average number of fire-related yearly deaths is 0. The highest number of deaths - 1 took place in 2010, and the lowest - 0 in 2002. The data has a growing trend.
The average number of deaths per 1,000 fire incidents is 1. This indicator was the highest - 5 in 2018, and the lowest 0 in 2002. The trend for deaths per 1,000 fire incidents is growing. Compared to the state value the number of deaths per 1,000 fire incidents is lower.Deaths per 1,000 incidents in Spring Lake, NC compared to nearest cities:
(Note: Based on data for all years, including only cities with at least 2,500 fire incidents)
| Spring Lake: | 0.8 |
| Fayetteville: | 1.0 |
| Hope Mills: | 0.7 |
| Lillington: | 2.1 |
| Cameron: | 0.3 |
| Raeford: | 0.0 |
| Dunn: | 1.5 |
| Sanford: | 0.9 |
| Lumberton: | 2.0 |
 29.6% incidents where reported in the morning and 70.4% in the evening. The most fires (15.3%) took place on Monday, and the least (12.8%) on Thursday.
 Based on the 3,538 reports from years 2002 - 2018 most fires (12.8%) took place during March, and the least (5.8%) in August.
 Out of all 16,349 cases reported during the years 2002 - 2018, the most belonged to the categories: Rescue & EMS (37.0%), Good Intent Call (22.4%), and Fire (21.6%).
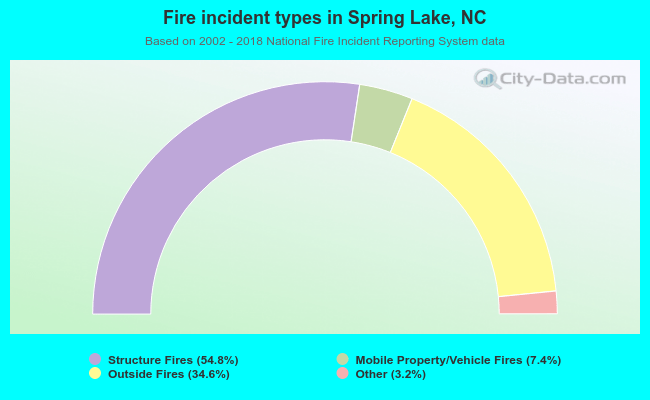 When looking into fire subcategories, the most reports belonged to: Structure Fires (54.8%), and Outside Fires (34.6%).