Aberdeen: Fire Incidents, North Carolina (NC)
Where are fire incidents reported in Aberdeen, NC
Something went wrong! Please refresh the page.
| Fire incidents reported | |
|---|---|
| Sreet name | Count |
| PROVIDENCE PL | 1,006 |
| SANDHILLS BLVD | 160 |
| RESERVATION RD | 114 |
| POPLAR ST | 68 |
| MAGNOLIA DR | 60 |
| CALLOWAY RD | 54 |
| ABERDEEN RD | 52 |
| CAROLINA RD | 52 |
| NC 211 HWY | 48 |
| MAIN ST | 44 |
| COLUMBUS DR | 42 |
| ARMY RD | 38 |
| PINEHURST ST | 38 |
| MICHAEL LA | 34 |
| MIDWAY RD | 32 |
| ROSELAND RD | 32 |
| SOUTH ST | 32 |
| U.S. HWY 15-501 | 32 |
| U.S. HWY. #1 | 30 |
| STROTHER RD | 28 |
| US 1 HWY | 28 |
| INDIANA AVE | 26 |
| SHELTON DR | 26 |
| US 15501 HWY | 24 |
| WOODGREEN DR | 24 |
| BRADFORD DR | 22 |
| KEYSER ST | 22 |
| N.C.HWY 211 | 22 |
| NC HWY 5 | 22 |
| PEEDEE RD | 20 |
| Other | 116 |
2002 - 2018 National Fire Incident Reporting System (NFIRS) incidents
- Incident types reported to NFIRS in Aberdeen, NC
- 2,92631.2%Rescue & EMS
- 2,34825.0%Fire
- 1,28913.7%Good Intent Call
- 1,23713.2%Service Call
- 7908.4%Hazardous Condition
- 6446.9%False Alarm
- 1511.6%Severe Weather
- Fire incident types reported to NFIRS in Aberdeen, NC
- 1,49463.6%Structure Fires
- 68029.0%Outside Fires
- 1616.9%Mobile Property/Vehicle Fires
- 130.6%Other
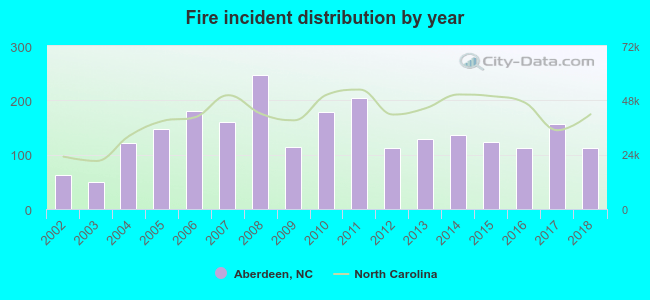 According to the data from the years 2002 - 2018 the average number of fires per year is 138. The highest number of fires - 247 took place in 2008, and the least - 49 in 2003. The data has a growing trend.
The average number of yearly fire incidents per 10k residents in Aberdeen, NC compared to nearest cities:
(Note: Based on data for the last 3 years, including only cities with population 5,000 and above)
| Aberdeen: | 178.1 |
| Southern Pines: | 88.4 |
| Pinehurst: | 47.3 |
| Rockingham: | 119.3 |
| Hamlet: | 85.0 |
| Fort Bragg: | 0.3 |
| Spring Lake: | 144.1 |
| Laurinburg: | 99.6 |
| Sanford: | 128.7 |
 The median response time based on all reported fire incidents is 5 minutes. This is lower than the North Carolina median value.
The median response time in Aberdeen, NC compared to nearest cities:
(Note: Based on data for all years, including only cities with at least 500 fire incidents)
| Aberdeen: | 5 minutes |
| Pinebluff: | 8 minutes |
| Southern Pines: | 5 minutes |
| Pinehurst: | 6 minutes |
| Vass: | 7 minutes |
| Carthage: | 9 minutes |
| Raeford: | 8 minutes |
| Cameron: | 8 minutes |
| Robbins: | 9 minutes |
 Based on the reports from the years 2002 - 2018 the average number of fire-related yearly casualties is 1. The highest number of casualties - 2 took place in 2010, and the lowest - 0 in 2002. The data has an increasing trend.
The average number of casualties per 1,000 fires is 5. This indicator was the highest - 18 in 2018, and the lowest 0 in 2002. The trend for injuries per 1,000 incidents is growing. Compared to the state value the number of injuries per 1,000 incidents is lower.
Based on the reports from the years 2002 - 2018 the average number of fire-related yearly casualties is 1. The highest number of casualties - 2 took place in 2010, and the lowest - 0 in 2002. The data has an increasing trend.
The average number of casualties per 1,000 fires is 5. This indicator was the highest - 18 in 2018, and the lowest 0 in 2002. The trend for injuries per 1,000 incidents is growing. Compared to the state value the number of injuries per 1,000 incidents is lower.
 30.4% incidents where reported in the morning and 69.6% in the evening. The most fires (17.0%) took place on Saturday, and the least (13.0%) on Sunday.
 According to the 2,348 fire incident reports from years 2002 - 2018 most fires (12.0%) took place during March, and the least (5.5%) in September.
 Out of all 9,393 cases reported during the years 2002 - 2018, the most belonged to the categories: Rescue & EMS (31.2%), Fire (25.0%), and Good Intent Call (13.7%).
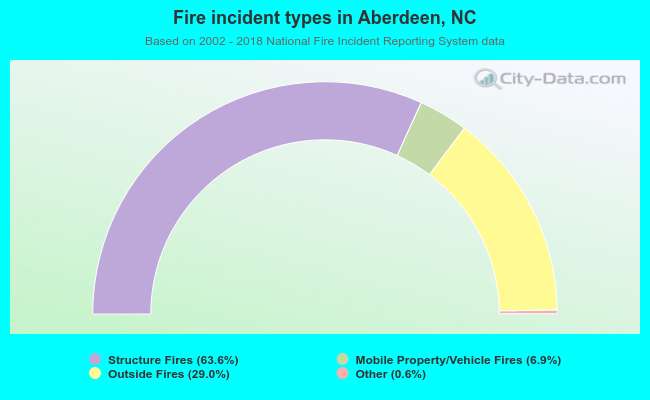 When looking into fire subcategories, the most incidents belonged to: Structure Fires (63.6%), and Outside Fires (29.0%).