Pinehurst: Fire Incidents, North Carolina (NC)
Where are fire incidents reported in Pinehurst, NC
Something went wrong! Please refresh the page.
| Fire incidents reported | |
|---|---|
| Sreet name | Count |
| MEMORIAL DR | 54 |
| BEULAH HILL RD | 46 |
| US 15501 HWY | 46 |
| BLAKE BLVD | 42 |
| LINDEN RD | 42 |
| MIDLAND RD | 40 |
| 5 HWY | 34 |
| MORGANTON RD | 32 |
| JUNIPER CREEK BLVD | 28 |
| RATTLESNAKE TRL | 26 |
| CAROLINA VISTA | 24 |
| LAKE DORNOCH DR | 24 |
| LONGLEAF DR | 24 |
| KELLY RD | 22 |
| CAROLINA VISTA DR | 20 |
| CHERRY HILL DR | 20 |
| REGIONAL DR | 20 |
| BURNING TREE RD | 18 |
| PINEWILD DR | 18 |
| 15-501 HWY | 16 |
| DIAMONDHEAD DR | 16 |
| AIRPORT RD | 14 |
| CAROLINA VIS | 14 |
| CHEROKEE RD | 14 |
| CHINQUAPIN RD | 14 |
| MONTICELLO DR | 14 |
| NC 5 HWY | 14 |
| FOXFIRE RD | 12 |
| JUNIPER LAKE RD | 12 |
| LAKE FOREST DR | 12 |
| Other | 240 |
2002 - 2018 National Fire Incident Reporting System (NFIRS) incidents
- Incident types reported to NFIRS in Pinehurst, NC
- 2,18225.0%Good Intent Call
- 1,85821.3%Hazardous Condition
- 1,39216.0%Rescue & EMS
- 1,27014.6%False Alarm
- 97211.1%Fire
- 8279.5%Service Call
- 1972.3%Severe Weather
- 210.2%Overpressure Rupture
- Fire incident types reported to NFIRS in Pinehurst, NC
- 63465.2%Structure Fires
- 26427.2%Outside Fires
- 596.1%Mobile Property/Vehicle Fires
- 151.5%Other
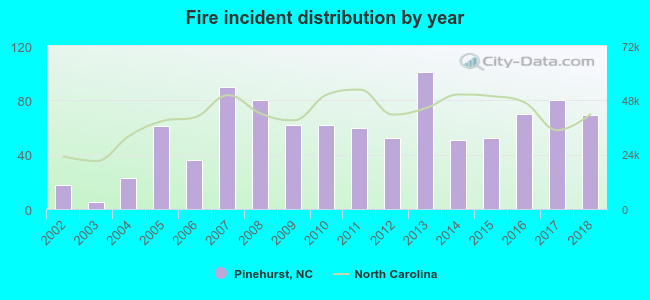 Based on the data from the years 2002 - 2018 the average number of fires per year is 57. The highest number of fires - 101 took place in 2013, and the least - 5 in 2003. The data has an increasing trend.
The average number of yearly fire incidents per 10k residents in Pinehurst, NC compared to nearest cities:
(Note: Based on data for the last 3 years, including only cities with population 5,000 and above)
| Pinehurst: | 47.3 |
| Southern Pines: | 88.4 |
| Aberdeen: | 178.1 |
| Rockingham: | 119.3 |
| Sanford: | 128.7 |
| Hamlet: | 85.0 |
| Fort Bragg: | 0.3 |
| Spring Lake: | 144.1 |
| Laurinburg: | 99.6 |
 The median response time based on all reported fire incidents is 6 minutes. This is about the same as the North Carolina median value.
The median response time in Pinehurst, NC compared to nearest cities:
(Note: Based on data for all years, including only cities with at least 500 fire incidents)
| Pinehurst: | 6 minutes |
| Southern Pines: | 5 minutes |
| Aberdeen: | 5 minutes |
| Pinebluff: | 8 minutes |
| Carthage: | 9 minutes |
| Vass: | 7 minutes |
| Cameron: | 8 minutes |
| Robbins: | 9 minutes |
| Raeford: | 8 minutes |
 According to the reports from the years 2002 - 2018 the average number of fire-related casualties per year is 0. The highest number of casualties - 1 took place in 2007, and the lowest - 0 in 2002. The data has an increasing trend.
The average number of casualties per 1,000 fire incidents is 2. This indicator was the highest - 16 in 2010, and the lowest 0 in 2002. The trend for injuries per 1,000 incidents is increasing. Compared to the North Carolina value the number of injuries per 1,000 fire incidents is lower.
According to the reports from the years 2002 - 2018 the average number of fire-related casualties per year is 0. The highest number of casualties - 1 took place in 2007, and the lowest - 0 in 2002. The data has an increasing trend.
The average number of casualties per 1,000 fire incidents is 2. This indicator was the highest - 16 in 2010, and the lowest 0 in 2002. The trend for injuries per 1,000 incidents is increasing. Compared to the North Carolina value the number of injuries per 1,000 fire incidents is lower.
 29.3% incidents where reported in the morning and 70.7% in the evening. The most fires (16.3%) took place on Sunday, and the least (11.7%) on Thursday.
 Based on the 972 reports from years 2002 - 2018 most fires (13.4%) took place during April, and the least (6.4%) in December.
 Out of all 8,722 cases reported during the years 2002 - 2018, the most belonged to the categories: Good Intent Call (25.0%), Hazardous Condition (21.3%), and Rescue & EMS (16.0%).
 When looking into fire subcategories, the most incidents belonged to: Structure Fires (65.2%), and Outside Fires (27.2%).