Laurinburg: Fire Incidents, North Carolina (NC)
Where are fire incidents reported in Laurinburg, NC
Something went wrong! Please refresh the page.
| Fire incidents reported | |
|---|---|
| Sreet name | Count |
| ABERDEEN RD | 98 |
| OLD LUMBERTON RD | 86 |
| MAIN ST | 84 |
| AIRBASE RD | 80 |
| MCGIRTS BRIDGE RD | 62 |
| TURNPIKE RD | 60 |
| CRESTLINE RD | 54 |
| BLAKELY RD | 52 |
| HASTY RD | 50 |
| JOHNS RD | 46 |
| BIGGS ST | 44 |
| HWY 74 BUSINESS | 40 |
| LEES MILL RD | 36 |
| LEISURE RD | 36 |
| BARNES BRIDGE RD | 34 |
| OLD WIRE RD | 34 |
| AIRPORT RD | 32 |
| PEA BRIDGE RD | 32 |
| VANCE ST | 32 |
| MCFARLAND RD | 30 |
| GILL ST | 28 |
| HIGHLAND RD | 28 |
| HWY 401 S | 28 |
| MCLAUGHLIN RD | 28 |
| PRODUCE MARKET RD | 28 |
| HWY 74 BYPASS | 26 |
| BOSTIC RD | 24 |
| HARRISON RD | 24 |
| PLAZA RD | 24 |
| ACADEMY RD | 22 |
| Other | 1,640 |
2002 - 2018 National Fire Incident Reporting System (NFIRS) incidents
- Incident types reported to NFIRS in Laurinburg, NC
- 2,92249.5%Fire
- 98516.7%False Alarm
- 86314.6%Hazardous Condition
- 4046.8%Good Intent Call
- 4016.8%Rescue & EMS
- 1873.2%Service Call
- 1272.2%Severe Weather
- 90.2%Special Incident
- Fire incident types reported to NFIRS in Laurinburg, NC
- 1,18040.4%Outside Fires
- 1,16940.0%Structure Fires
- 43214.8%Mobile Property/Vehicle Fires
- 1414.8%Other
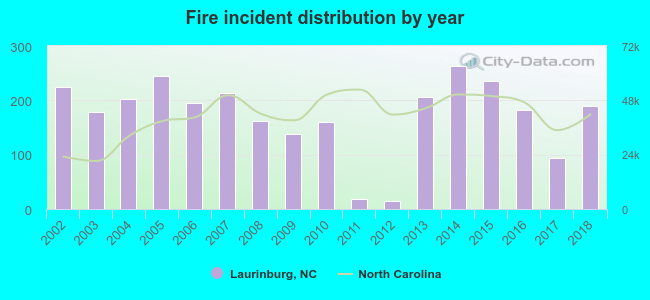 Based on the data from the years 2002 - 2018 the average number of fire incidents per year is 172. The highest number of fire incidents - 264 took place in 2014, and the least - 14 in 2012. The data has a dropping trend.
The average number of yearly fire incidents per 10k residents in Laurinburg, NC compared to nearest cities:
(Note: Based on data for the last 3 years, including only cities with population 5,000 and above)
| Laurinburg: | 99.6 |
| Hamlet: | 85.0 |
| Rockingham: | 119.3 |
| Aberdeen: | 178.1 |
| Lumberton: | 156.6 |
| Southern Pines: | 88.4 |
| Pinehurst: | 47.3 |
| Hope Mills: | 205.7 |
| Wadesboro: | 86.0 |
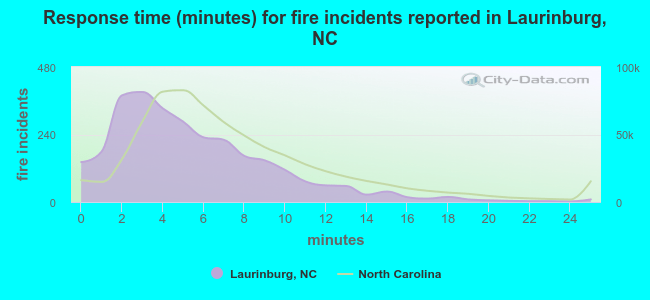 The median response time based on all reported fire incidents is 5 minutes. This is lower compared to the North Carolina median value.
The median response time in Laurinburg, NC compared to nearest cities:
(Note: Based on data for all years, including only cities with at least 500 fire incidents)
| Laurinburg: | 5 minutes |
| Maxton: | 12 minutes |
| Hamlet: | 7 minutes |
| Red Springs: | 9 minutes |
| Pembroke: | 11 minutes |
| Rowland: | 12 minutes |
| Shannon: | 10 minutes |
| Raeford: | 8 minutes |
| Rockingham: | 6 minutes |
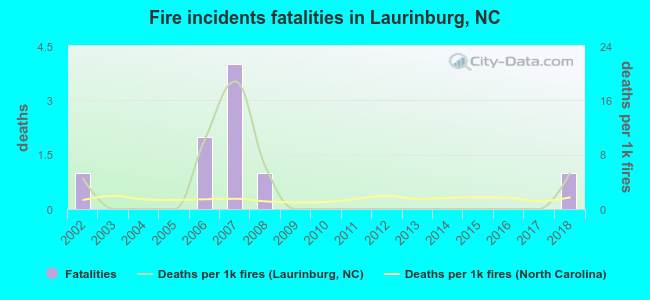 According to the reports from the years 2002 - 2018 the average number of fire-related yearly deaths is 1. The highest number of reported deaths - 4 took place in 2007, and the lowest - 0 in 2003. The data has a constant trend.
The average number of deaths per 1,000 fires is 3. This indicator was the highest - 19 in 2007, and the lowest 0 in 2003. The trend for fatalities per 1,000 incidents is growing. Compared to the North Carolina value the number of deaths per 1,000 incidents is much higher.
According to the reports from the years 2002 - 2018 the average number of fire-related yearly deaths is 1. The highest number of reported deaths - 4 took place in 2007, and the lowest - 0 in 2003. The data has a constant trend.
The average number of deaths per 1,000 fires is 3. This indicator was the highest - 19 in 2007, and the lowest 0 in 2003. The trend for fatalities per 1,000 incidents is growing. Compared to the North Carolina value the number of deaths per 1,000 incidents is much higher.Deaths per 1,000 incidents in Laurinburg, NC compared to nearest cities:
(Note: Based on data for all years, including only cities with at least 2,500 fire incidents)
| Laurinburg: | 3.1 |
| Raeford: | 0.0 |
| Lumberton: | 2.0 |
| Hope Mills: | 0.7 |
| Fayetteville: | 1.0 |
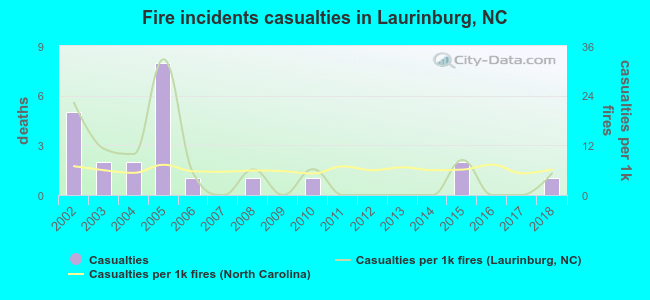 Based on the data from the years 2002 - 2018 the average number of fire-related casualties per year is 1. The highest number of reported injuries - 8 took place in 2005, and the lowest - 0 in 2007. The data has a declining trend.
The average number of injuries per 1,000 fire incidents is 6. This indicator was the highest - 33 in 2005, and the lowest 0 in 2007. The trend for injuries per 1,000 fire incidents is decreasing. Compared to the state value the number of casualties per 1,000 fire incidents is higher.
Based on the data from the years 2002 - 2018 the average number of fire-related casualties per year is 1. The highest number of reported injuries - 8 took place in 2005, and the lowest - 0 in 2007. The data has a declining trend.
The average number of injuries per 1,000 fire incidents is 6. This indicator was the highest - 33 in 2005, and the lowest 0 in 2007. The trend for injuries per 1,000 fire incidents is decreasing. Compared to the state value the number of casualties per 1,000 fire incidents is higher.Casualties per 1,000 incidents in Laurinburg, NC compared to nearest cities:
(Note: Based on data for all years, including only cities with at least 500 fire incidents)
| Laurinburg: | 7.9 |
| Maxton: | 0.0 |
| Hamlet: | 1.2 |
| Red Springs: | 1.3 |
| Pembroke: | 0.7 |
| Rowland: | 0.0 |
| Shannon: | 0.0 |
| Raeford: | 1.8 |
| Rockingham: | 1.7 |
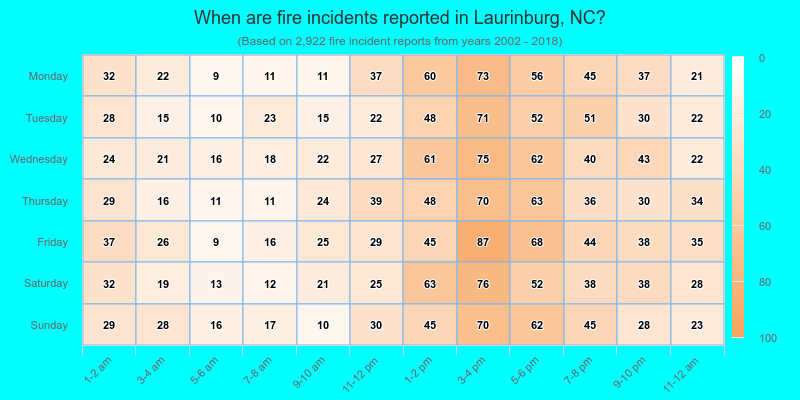
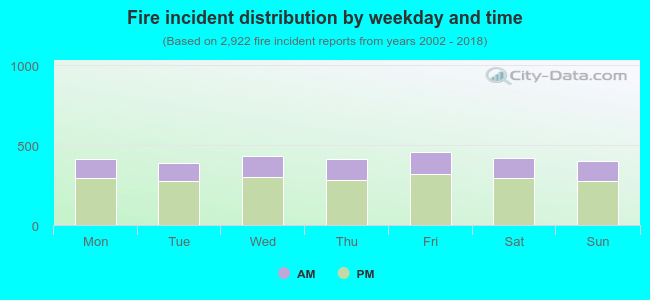 30.4% incidents where reported in the morning and 69.6% in the evening. The most fires (15.7%) took place on Friday, and the least (13.2%) on Tuesday.
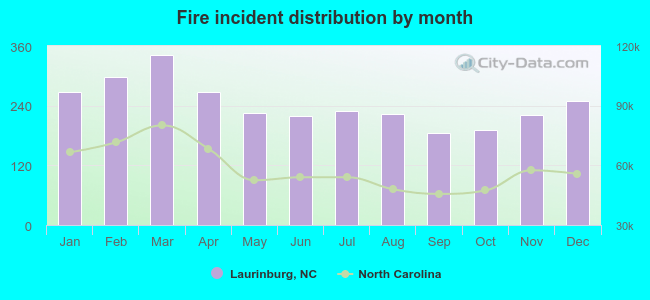 According to the 2,922 fire incidents from years 2002 - 2018 most fires (11.7%) took place during March, and the least (6.3%) in September.
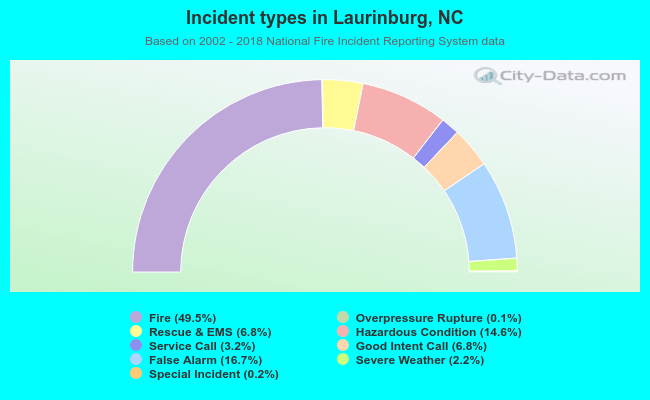 Out of all 5,901 cases reported during the years 2002 - 2018, the most belonged to the categories: Fire (49.5%), False Alarm (16.7%), and Hazardous Condition (14.6%).
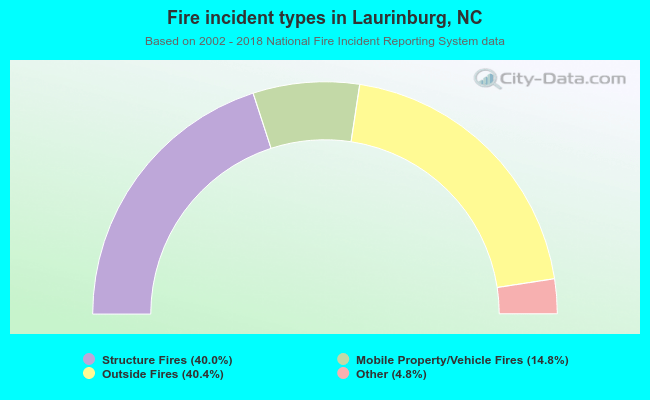 When looking into fire subcategories, the most reports belonged to: Outside Fires (40.4%), and Structure Fires (40.0%).