Dunn: Fire Incidents, North Carolina (NC)
Where are fire incidents reported in Dunn, NC
Something went wrong! Please refresh the page.
| Fire incidents reported | |
|---|---|
| Sreet name | Count |
| CUMBERLAND ST | 272 |
| INTERSTATE 95 | 234 |
| FAIRGROUND RD | 114 |
| JONESBORO RD | 98 |
| BROAD ST | 96 |
| SPRING BRANCH RD | 96 |
| HODGES CHAPEL RD | 94 |
| HARNETT ST | 88 |
| MCKAY AVE | 80 |
| ARROWHEAD RD | 66 |
| NC 55 | 66 |
| PEARSALL ST | 62 |
| CLINTON AVE | 58 |
| DIVINE ST | 56 |
| TIMOTHY RD | 56 |
| FAYETTEVILLE AVE | 52 |
| GREEN PATH RD | 52 |
| PLAIN VIEW HWY | 52 |
| WEEKS RD | 52 |
| ERWIN RD | 48 |
| LONGBRANCH RD | 48 |
| RED HILL CHURCH RD | 48 |
| US 301 | 48 |
| ASHE AVE | 46 |
| ELLIS AVE | 46 |
| HOBSON RD | 46 |
| BLACKMAN RD | 44 |
| BUD HAWKINS RD | 44 |
| CAROLINA DR | 44 |
| IRA B TART RD | 44 |
| Other | 1,090 |
2002 - 2018 National Fire Incident Reporting System (NFIRS) incidents
- Incident types reported to NFIRS in Dunn, NC
- 3,34035.6%Fire
- 2,33224.8%Rescue & EMS
- 1,31514.0%Good Intent Call
- 9229.8%False Alarm
- 9189.8%Hazardous Condition
- 4655.0%Service Call
- 860.9%Severe Weather
- Fire incident types reported to NFIRS in Dunn, NC
- 1,53646.0%Structure Fires
- 1,25937.7%Outside Fires
- 45813.7%Mobile Property/Vehicle Fires
- 872.6%Other
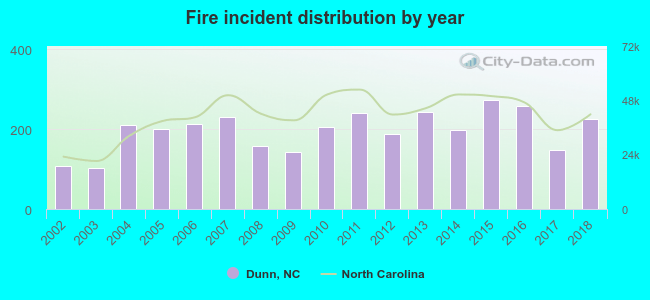 According to the data from the years 2002 - 2018 the average number of fire incidents per year is 196. The highest number of fires - 272 took place in 2015, and the least - 102 in 2003. The data has a growing trend.
The average number of yearly fire incidents per 10k residents in Dunn, NC compared to nearest cities:
(Note: Based on data for the last 3 years, including only cities with population 5,000 and above)
| Dunn: | 217.0 |
| Smithfield: | 152.5 |
| Spring Lake: | 144.1 |
| Selma: | 204.6 |
| Fayetteville: | 65.8 |
| Clayton: | 129.0 |
| Fort Bragg: | 0.3 |
| Clinton: | 126.3 |
| Holly Springs: | 24.0 |
 The median response time based on all reported fire incidents is 8 minutes. This is higher compared to the North Carolina median value.
The median response time in Dunn, NC compared to nearest cities:
(Note: Based on data for all years, including only cities with at least 500 fire incidents)
| Dunn: | 8 minutes |
| Erwin: | 8 minutes |
| Benson: | 9 minutes |
| Coats: | 8 minutes |
| Linden: | 10 minutes |
| Bunnlevel: | 9 minutes |
| Wade: | 9 minutes |
| Lillington: | 9 minutes |
| Four Oaks: | 9 minutes |
 According to the data from the years 2002 - 2018 the average number of fire-related fatalities per year is 0. The highest number of deaths - 1 took place in 2002, and the lowest - 0 in 2003. The data has a constant trend.
The average number of deaths per 1,000 fire incidents is 2. This indicator was the highest - 9 in 2002, and the lowest 0 in 2003. The trend for deaths per 1,000 fire incidents is declining. Compared to the state value the number of fatalities per 1,000 incidents is about the same.
According to the data from the years 2002 - 2018 the average number of fire-related fatalities per year is 0. The highest number of deaths - 1 took place in 2002, and the lowest - 0 in 2003. The data has a constant trend.
The average number of deaths per 1,000 fire incidents is 2. This indicator was the highest - 9 in 2002, and the lowest 0 in 2003. The trend for deaths per 1,000 fire incidents is declining. Compared to the state value the number of fatalities per 1,000 incidents is about the same.Deaths per 1,000 incidents in Dunn, NC compared to nearest cities:
(Note: Based on data for all years, including only cities with at least 2,500 fire incidents)
| Dunn: | 1.5 |
| Lillington: | 2.1 |
| Spring Lake: | 0.8 |
| Fayetteville: | 1.0 |
| Clayton: | 0.0 |
| Garner: | 1.6 |
| Hope Mills: | 0.7 |
| Sanford: | 0.9 |
| Cary: | 1.1 |
 According to the data from the years 2002 - 2018 the average number of fire-related casualties per year is 2. The highest number of casualties - 7 took place in 2004, and the lowest - 0 in 2009. The data has a dropping trend.
The average number of casualties per 1,000 fire incidents is 12. This indicator was the highest - 47 in 2002, and the lowest 0 in 2009. The trend for injuries per 1,000 incidents is decreasing. Compared to the North Carolina value the number of injuries per 1,000 fires is higher.
According to the data from the years 2002 - 2018 the average number of fire-related casualties per year is 2. The highest number of casualties - 7 took place in 2004, and the lowest - 0 in 2009. The data has a dropping trend.
The average number of casualties per 1,000 fire incidents is 12. This indicator was the highest - 47 in 2002, and the lowest 0 in 2009. The trend for injuries per 1,000 incidents is decreasing. Compared to the North Carolina value the number of injuries per 1,000 fires is higher.
 29.8% incidents where reported in the morning and 70.2% in the evening. The most fires (16.9%) took place on Saturday, and the least (12.9%) on Wednesday.
 According to the 3,340 incident reports from years 2002 - 2018 most fires (12.5%) took place during March, and the least (6.9%) in May.
 Out of all 9,392 cases reported during the years 2002 - 2018, the most belonged to the categories: Fire (35.6%), Rescue & EMS (24.8%), and Good Intent Call (14.0%).
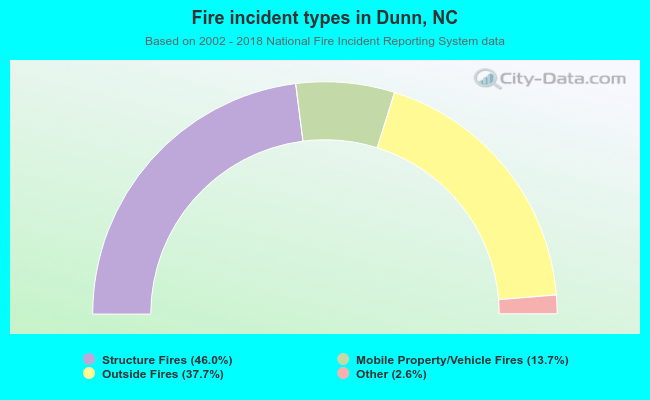 When looking into fire subcategories, the most incidents belonged to: Structure Fires (46.0%), and Outside Fires (37.7%).