Clayton: Fire Incidents, North Carolina (NC)
Where are fire incidents reported in Clayton, NC
Something went wrong! Please refresh the page.
| Fire incidents reported | |
|---|---|
| Sreet name | Count |
| US 70 HWY | 312 |
| BUFFALO RD | 130 |
| US 70 BUS HWY | 114 |
| MAIN ST | 102 |
| CLEVELAND RD | 90 |
| NC 42 HWY | 88 |
| BARBER MILL RD | 80 |
| US 70 BUS 8691-14023 HWY | 74 |
| SHOTWELL RD | 68 |
| LITTLE CREEK CHURCH RD | 66 |
| LOMBARD ST | 64 |
| US 70 BUS 869114023 HWY | 62 |
| JACK RD | 56 |
| GLEN LAUREL RD | 54 |
| BOLING ST | 52 |
| POWHATAN RD | 52 |
| DAIRY RD | 50 |
| GOVERNMENT RD | 48 |
| WINSTON RD | 48 |
| CASTLEBERRY RD | 42 |
| LOOP RD | 42 |
| MATTHEWS RD | 42 |
| VINSON RD | 42 |
| AMELIA CHURCH RD | 40 |
| NORRIS RD | 38 |
| SLATE TOP RD | 38 |
| FAYETTEVILLE ST | 36 |
| RANCH RD | 36 |
| US HWY 70 BUS W | 36 |
| ROBERTSON ST | 34 |
| Other | 1,747 |
2003 - 2018 National Fire Incident Reporting System (NFIRS) incidents
- Incident types reported to NFIRS in Clayton, NC
- 8,12844.0%Rescue & EMS
- 3,78320.5%Fire
- 2,26612.3%Hazardous Condition
- 1,97410.7%Good Intent Call
- 1,5718.5%False Alarm
- 5312.9%Service Call
- 1620.9%Severe Weather
- 260.1%Special Incident
- Fire incident types reported to NFIRS in Clayton, NC
- 1,83648.5%Structure Fires
- 1,40137.0%Outside Fires
- 43211.4%Mobile Property/Vehicle Fires
- 1143.0%Other
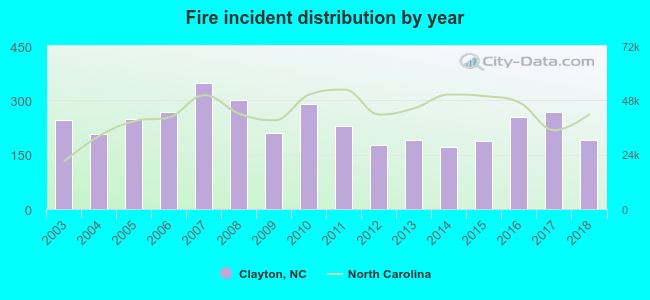 According to the data from the years 2003 - 2018 the average number of fires per year is 236. The highest number of fires - 347 took place in 2007, and the least - 170 in 2014. The data has a decreasing trend.
The average number of yearly fire incidents per 10k residents in Clayton, NC compared to nearest cities:
(Note: Based on data for the last 3 years, including only cities with population 5,000 and above)
| Clayton: | 129.0 |
| Garner: | 53.3 |
| Knightdale: | 119.9 |
| Wendell: | 196.8 |
| Smithfield: | 152.5 |
| Selma: | 204.6 |
| Raleigh: | 24.8 |
| Rolesville: | 25.9 |
| Holly Springs: | 24.0 |
 The median response time based on all reported fire incidents is 8 minutes. This is higher compared to the North Carolina median value.
The median response time in Clayton, NC compared to nearest cities:
(Note: Based on data for all years, including only cities with at least 500 fire incidents)
| Clayton: | 8 minutes |
| Garner: | 5 minutes |
| Knightdale: | 5 minutes |
| Wendell: | 6 minutes |
| Smithfield: | 7 minutes |
| Selma: | 8 minutes |
| Four Oaks: | 9 minutes |
| Zebulon: | 6 minutes |
| Raleigh: | 5 minutes |
 27.1% incidents where reported in the morning and 72.9% in the evening. The most fires (16.2%) took place on Saturday, and the least (12.4%) on Wednesday.
 According to the 3,783 fires from years 2003 - 2018 most fires (10.8%) took place during February, and the least (6.4%) in October.
 Out of all 18,452 cases reported during the years 2003 - 2018, the most belonged to the categories: Rescue & EMS (44.0%), Fire (20.5%), and Hazardous Condition (12.3%).
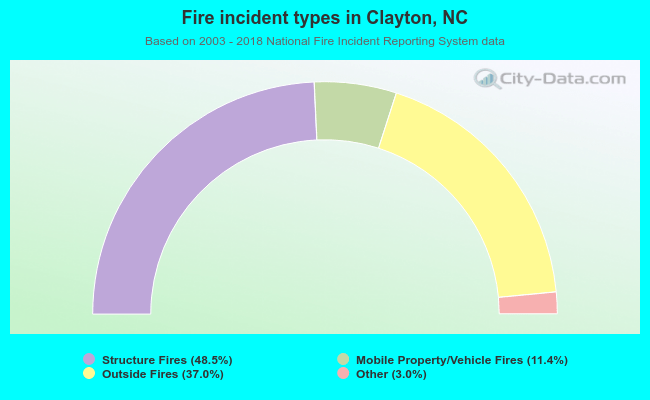 When looking into fire subcategories, the most reports belonged to: Structure Fires (48.5%), and Outside Fires (37.0%).