Wendell: Fire Incidents, North Carolina (NC)
Where are fire incidents reported in Wendell, NC
Something went wrong! Please refresh the page.
|
| |||||||||||||||||||||||||||||||||||||||||||||||||||||||||||||||||||||||||||||||||||||||||||||||||||||||||||||
| Other | 178 | |||||||||||||||||||||||||||||||||||||||||||||||||||||||||||||||||||||||||||||||||||||||||||||||||||||||||||||
2002 - 2018 National Fire Incident Reporting System (NFIRS) incidents
- Incident types reported to NFIRS in Wendell, NC
- 7,52759.2%Rescue & EMS
- 1,83814.5%Fire
- 1,1238.8%Good Intent Call
- 8857.0%Hazardous Condition
- 7355.8%False Alarm
- 5013.9%Service Call
- 860.7%Severe Weather
- Fire incident types reported to NFIRS in Wendell, NC
- 81544.3%Structure Fires
- 66536.2%Outside Fires
- 31817.3%Mobile Property/Vehicle Fires
- 402.2%Other
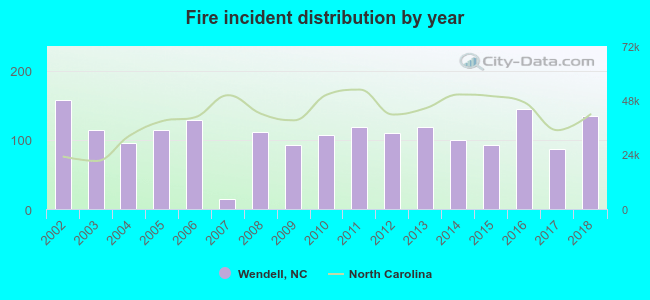 According to the data from the years 2002 - 2018 the average number of fires per year is 108. The highest number of fires - 157 took place in 2002, and the least - 14 in 2007. The data has a decreasing trend.
The average number of yearly fire incidents per 10k residents in Wendell, NC compared to nearest cities:
(Note: Based on data for the last 3 years, including only cities with population 5,000 and above)
| Wendell: | 196.8 |
| Knightdale: | 119.9 |
| Clayton: | 129.0 |
| Rolesville: | 25.9 |
| Garner: | 53.3 |
| Wake Forest: | 42.9 |
| Raleigh: | 24.8 |
| Selma: | 204.6 |
| Smithfield: | 152.5 |
 The median response time based on all reported fire incidents is 6 minutes. This is about the same as the North Carolina median value.
The median response time in Wendell, NC compared to nearest cities:
(Note: Based on data for all years, including only cities with at least 500 fire incidents)
| Wendell: | 6 minutes |
| Zebulon: | 6 minutes |
| Knightdale: | 5 minutes |
| Middlesex: | 9 minutes |
| Clayton: | 8 minutes |
| Bunn: | 8 minutes |
| Bailey: | 10 minutes |
| Garner: | 5 minutes |
| Wake Forest: | 6 minutes |
 26.2% incidents where reported in the morning and 73.8% in the evening. The most fires (16.2%) took place on Sunday, and the least (12.0%) on Thursday.
 According to the 1,838 incident reports from years 2002 - 2018 most fires (10.3%) took place during April, and the least (6.3%) in September.
 Out of all 12,710 cases reported during the years 2002 - 2018, the most belonged to the categories: Rescue & EMS (59.2%), Fire (14.5%), and Good Intent Call (8.8%).
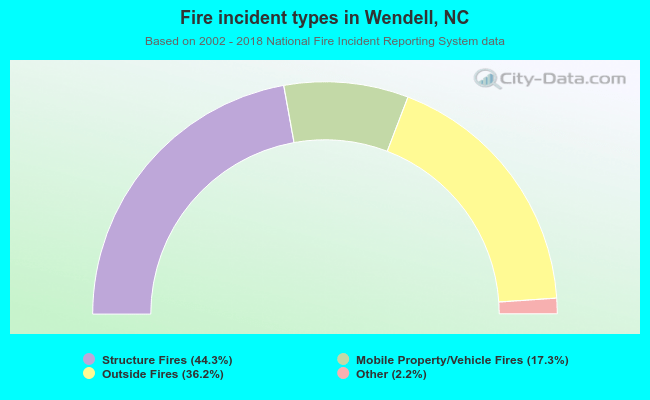 When looking into fire subcategories, the most reports belonged to: Structure Fires (44.3%), and Outside Fires (36.2%).