Severn: Fire Incidents, Maryland (MD)
Where are fire incidents reported in Severn, MD
Something went wrong! Please refresh the page.
| Fire incidents reported | |
|---|---|
| Sreet name | Count |
| TELEGRAPH RD | 58 |
| MEADE VILLAGE CIR | 48 |
| REECE RD | 48 |
| QUARTERFIELD RD | 30 |
| ARWELL CT | 26 |
| GEORGE CLAUSS BLVD | 26 |
| DONALDSON AVE | 18 |
| QUEENSTOWN RD | 18 |
| PIONEER DR | 16 |
| RICHFIELD DR | 16 |
| DELMONT RD | 14 |
| SANDY FARM RD | 14 |
| SEVERN ORCHARD CIR | 14 |
| BURNS CROSSING RD | 12 |
| STEVENSON RD | 12 |
| TWIN OAKS RD | 12 |
| CLARK STATION RD | 10 |
| EVERGREEN RD | 10 |
| FLINTLOCK CT | 10 |
| NEW CUT RD | 10 |
| RT 100 | 10 |
| SEA PINE CIR | 10 |
| SEVERN STATION RD | 10 |
| STILLMEADOWS DR | 10 |
| CANTER CT | 8 |
| CHALICE RD | 8 |
| DEER RUN CT | 8 |
| DERBY FARMS DR | 8 |
| DISNEY RD | 8 |
| MARYLAND AVE | 8 |
| Other | 166 |
2008 - 2018 National Fire Incident Reporting System (NFIRS) incidents
- Incident types reported to NFIRS in Severn, MD
- 6,29063.3%Rescue & EMS
- 1,07110.8%Good Intent Call
- 8348.4%Hazardous Condition
- 6766.8%Fire
- 6066.1%Service Call
- 4214.2%False Alarm
- 180.2%Special Incident
- 140.1%Overpressure Rupture
- Fire incident types reported to NFIRS in Severn, MD
- 34951.6%Structure Fires
- 21832.2%Outside Fires
- 8312.3%Mobile Property/Vehicle Fires
- 263.8%Other
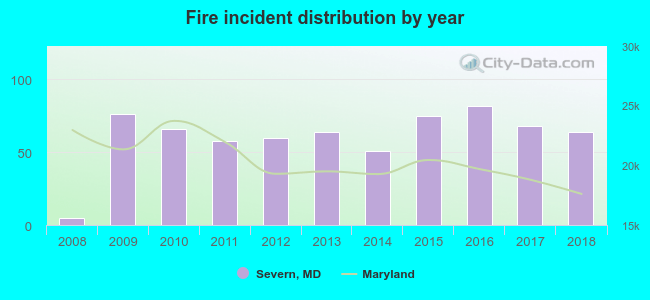 Based on the data from the years 2008 - 2018 the average number of fires per year is 61. The highest number of fires - 82 took place in 2016, and the least - 5 in 2008. The data has a growing trend.
The average number of yearly fire incidents per 10k residents in Severn, MD compared to nearest cities:
(Note: Based on data for the last 3 years, including only cities with population 5,000 and above)
| Severn: | 16.1 |
| Fort Meade: | 1.8 |
| Odenton: | 13.0 |
| Jessup: | 52.3 |
| Glen Burnie: | 36.9 |
| Ferndale: | 1.6 |
| Linthicum: | 31.6 |
| Elkridge: | 60.5 |
| Savage: | 11.8 |
 The median response time based on all reported fire incidents is 7 minutes. This is comparable to the state median value.
The median response time in Severn, MD compared to nearest cities:
(Note: Based on data for all years, including only cities with at least 500 fire incidents)
| Severn: | 7 minutes |
| Odenton: | 7 minutes |
| Jessup: | 7 minutes |
| Glen Burnie: | 6 minutes |
| Elkridge: | 7 minutes |
| Arbutus: | 5 minutes |
| Pasadena: | 6 minutes |
| Laurel: | 7 minutes |
| Columbia: | 6 minutes |
 Based on the reports from the years 2008 - 2018 the average number of fire-related casualties per year is 1. The highest number of reported injuries - 3 took place in 2012, and the lowest - 0 in 2008. The data has a constant trend.
The average number of injuries per 1,000 fire incidents is 19. This indicator was the highest - 50 in 2012, and the lowest 0 in 2008. The trend for injuries per 1,000 fire incidents is constant. Compared to the Maryland value the number of injuries per 1,000 fires is much higher.
Based on the reports from the years 2008 - 2018 the average number of fire-related casualties per year is 1. The highest number of reported injuries - 3 took place in 2012, and the lowest - 0 in 2008. The data has a constant trend.
The average number of injuries per 1,000 fire incidents is 19. This indicator was the highest - 50 in 2012, and the lowest 0 in 2008. The trend for injuries per 1,000 fire incidents is constant. Compared to the Maryland value the number of injuries per 1,000 fires is much higher.
 31.2% incidents where reported in the morning and 68.8% in the evening. The most fires (16.3%) took place on Sunday, and the least (11.7%) on Tuesday.
 According to the 676 incident reports from years 2008 - 2018 most fires (12.3%) took place during April, and the least (6.1%) in October.
 Out of all 9,935 cases reported during the years 2008 - 2018, the most belonged to the categories: Rescue & EMS (63.3%), Good Intent Call (10.8%), and Hazardous Condition (8.4%).
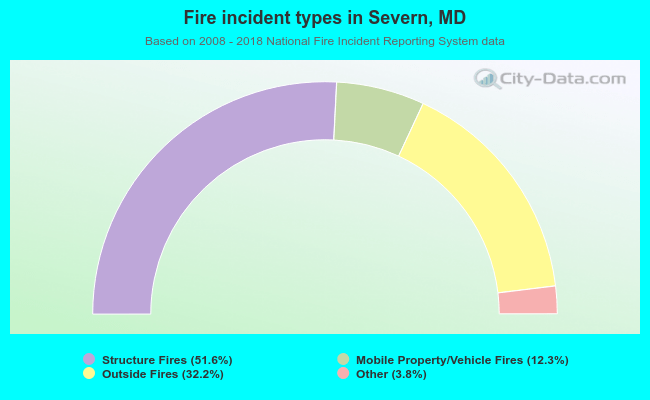 When looking into fire subcategories, the most incidents belonged to: Structure Fires (51.6%), and Outside Fires (32.2%).