Linthicum: Fire Incidents, Maryland (MD)
Where are fire incidents reported in Linthicum, MD
Something went wrong! Please refresh the page.
|
| |||||||||||||||||||||||||||||||||||||||||||||||||||||||||||||||||||||||||||||||||||||||||||||||||||||||||||||
2009 - 2018 National Fire Incident Reporting System (NFIRS) incidents
- Incident types reported to NFIRS in Linthicum, MD
- 3,01953.6%Rescue & EMS
- 89015.8%Good Intent Call
- 5159.1%Hazardous Condition
- 4528.0%False Alarm
- 3896.9%Fire
- 3626.4%Service Call
- 60.1%Special Incident
- Fire incident types reported to NFIRS in Linthicum, MD
- 14336.8%Outside Fires
- 12632.4%Structure Fires
- 11128.5%Mobile Property/Vehicle Fires
- 92.3%Other
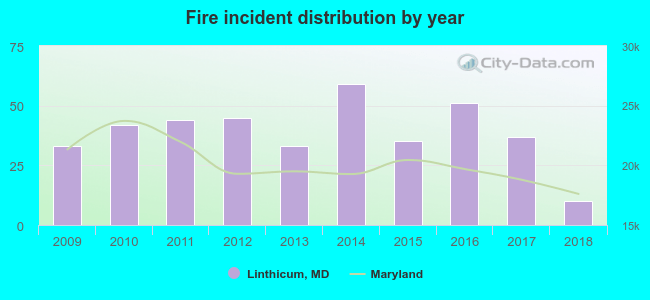 Based on the data from the years 2009 - 2018 the average number of fire incidents per year is 39. The highest number of reported fires - 59 took place in 2014, and the least - 10 in 2018. The data has a declining trend.
The average number of yearly fire incidents per 10k residents in Linthicum, MD compared to nearest cities:
(Note: Based on data for the last 3 years, including only cities with population 5,000 and above)
| Linthicum: | 31.6 |
| Ferndale: | 1.6 |
| Lansdowne: | 2.4 |
| Brooklyn Park: | 5.3 |
| Arbutus: | 19.4 |
| Glen Burnie: | 36.9 |
| Elkridge: | 60.5 |
| Severn: | 16.1 |
| Catonsville: | 21.1 |
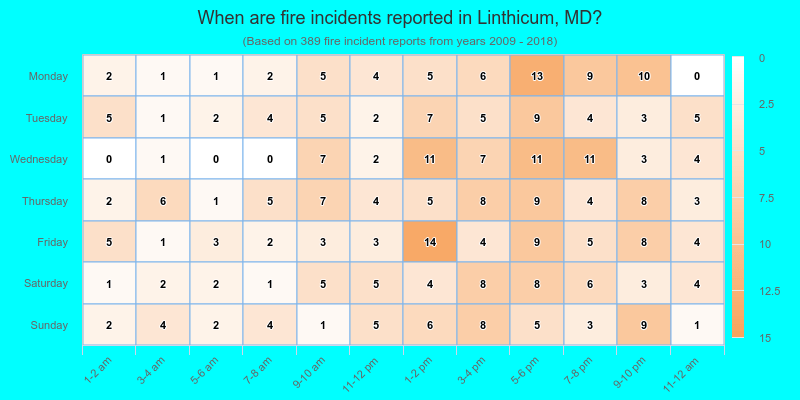
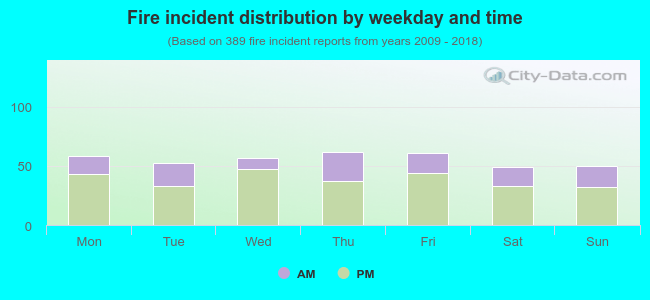 30.8% incidents where reported in the morning and 69.2% in the evening. The most fires (15.9%) took place on Thursday, and the least (12.6%) on Saturday.
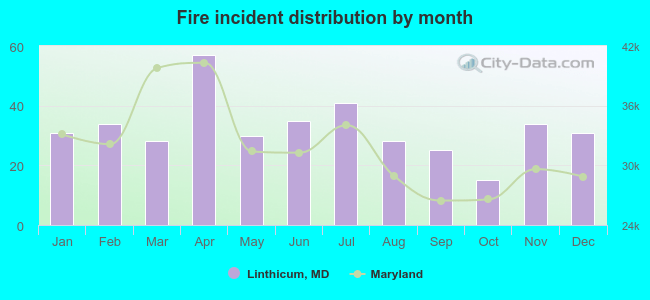 Based on the 389 reports from years 2009 - 2018 most fires (14.7%) took place during April, and the least (3.9%) in October.
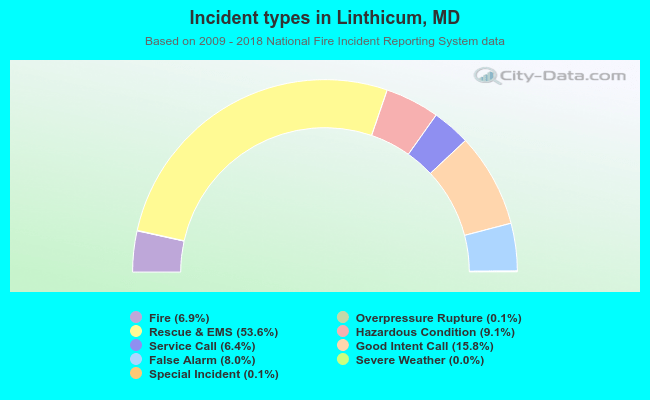 Out of all 5,637 cases reported during the years 2009 - 2018, the most belonged to the categories: Rescue & EMS (53.6%), Good Intent Call (15.8%), and Hazardous Condition (9.1%).
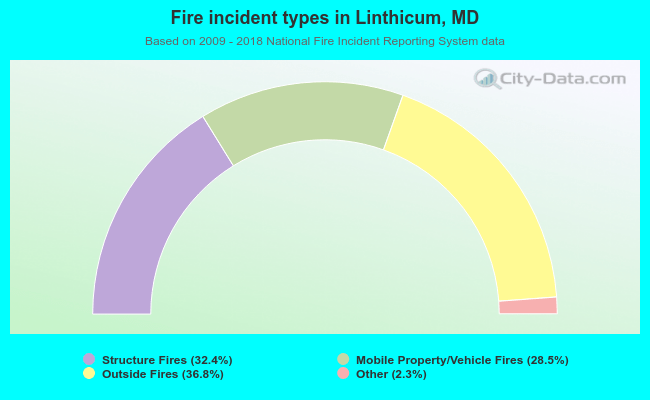 When looking into fire subcategories, the most incidents belonged to: Outside Fires (36.8%), and Structure Fires (32.4%).