Catonsville: Fire Incidents, Maryland (MD)
Where are fire incidents reported in Catonsville, MD
Something went wrong! Please refresh the page.
| Fire incidents reported | |
|---|---|
| Sreet name | Count |
| BALTO NAT PIKE | 330 |
| FREDERICK RD | 214 |
| ROLLING RD | 154 |
| BALTIMORE NATIONAL PIKE | 60 |
| EDMONDSON AV | 50 |
| MAIDEN CHOICE LN | 50 |
| INGLESIDE AV | 42 |
| OLD FREDERICK RD | 42 |
| WINTERS LN | 42 |
| BLOOMSBURY AV | 40 |
| RT 40 | 40 |
| HILLTOP RD | 32 |
| RIVER RD | 30 |
| EDMNSN AVBALTO NAT | 28 |
| HILLTOP CIR | 28 |
| EDMONDSON AVE | 24 |
| BEAUMONT AV | 20 |
| BELLE GROVE RD | 20 |
| EDMNSN AV*BALTO NAT | 20 |
| GARDEN RIDGE RD | 20 |
| MELVIN AV | 20 |
| WILKENS AVFRED RD | 20 |
| JOHNNYCAKE RD | 18 |
| OELLA AVE | 18 |
| BALTIMORE NATIONAL | 16 |
| I695 | 16 |
| WILKENS AV | 16 |
| WILKENS AV*FRED. RD | 16 |
| OELLA AV | 14 |
| SOUTHWESTERN BL*I95 | 14 |
2004 - 2018 National Fire Incident Reporting System (NFIRS) incidents
- Incident types reported to NFIRS in Catonsville, MD
- 26,42972.7%Rescue & EMS
- 3,5399.7%Hazardous Condition
- 2,0795.7%Good Intent Call
- 1,5634.3%False Alarm
- 1,4374.0%Fire
- 1,2263.4%Service Call
- 410.1%Overpressure Rupture
- Fire incident types reported to NFIRS in Catonsville, MD
- 70148.8%Outside Fires
- 38927.1%Mobile Property/Vehicle Fires
- 27619.2%Structure Fires
- 714.9%Other
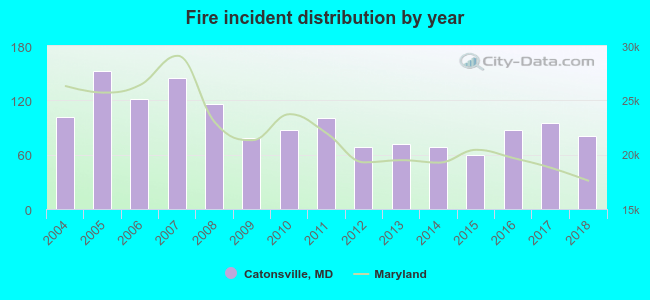 According to the data from the years 2004 - 2018 the average number of fires per year is 96. The highest number of fire incidents - 152 took place in 2005, and the least - 60 in 2015. The data has a decreasing trend.
The average number of yearly fire incidents per 10k residents in Catonsville, MD compared to nearest cities:
(Note: Based on data for the last 3 years, including only cities with population 5,000 and above)
| Catonsville: | 21.1 |
| Arbutus: | 19.4 |
| Lansdowne: | 2.4 |
| Ellicott City: | 18.3 |
| Elkridge: | 60.5 |
| Linthicum: | 31.6 |
| Baltimore: | 47.1 |
| Pikesville: | 21.3 |
| Brooklyn Park: | 5.3 |
 The median response time based on all reported fire incidents is 5 minutes. This is lower than the state median value.
The median response time in Catonsville, MD compared to nearest cities:
(Note: Based on data for all years, including only cities with at least 500 fire incidents)
| Catonsville: | 5 minutes |
| Arbutus: | 5 minutes |
| Ellicott City: | 7 minutes |
| Elkridge: | 7 minutes |
| Baltimore: | 6 minutes |
| Pikesville: | 5 minutes |
| Randallstown: | 5 minutes |
| Columbia: | 6 minutes |
| Jessup: | 7 minutes |
 Based on the reports from the years 2004 - 2018 the average number of fire-related yearly casualties is 0. The highest number of reported casualties - 1 took place in 2004, and the lowest - 0 in 2006. The data has a dropping trend.
The average number of casualties per 1,000 fires is 4. This indicator was the highest - 14 in 2013, and the lowest 0 in 2006. The trend for injuries per 1,000 fires is decreasing. Compared to the Maryland value the number of injuries per 1,000 incidents is much lower.
Based on the reports from the years 2004 - 2018 the average number of fire-related yearly casualties is 0. The highest number of reported casualties - 1 took place in 2004, and the lowest - 0 in 2006. The data has a dropping trend.
The average number of casualties per 1,000 fires is 4. This indicator was the highest - 14 in 2013, and the lowest 0 in 2006. The trend for injuries per 1,000 fires is decreasing. Compared to the Maryland value the number of injuries per 1,000 incidents is much lower.Casualties per 1,000 incidents in Catonsville, MD compared to nearest cities:
(Note: Based on data for all years, including only cities with at least 500 fire incidents)
| Catonsville: | 3.5 |
| Arbutus: | 1.5 |
| Ellicott City: | 15.5 |
| Elkridge: | 10.2 |
| Baltimore: | 11.4 |
| Pikesville: | 4.2 |
| Randallstown: | 7.7 |
| Columbia: | 18.9 |
| Jessup: | 8.5 |
 30.4% incidents where reported in the morning and 69.6% in the evening. The most fires (15.5%) took place on Friday, and the least (13.2%) on Wednesday.
 Based on the 1,437 incident reports from years 2004 - 2018 most fires (11.0%) took place during April, and the least (5.6%) in February.
 Out of all 36,353 cases reported during the years 2004 - 2018, the most belonged to the categories: Rescue & EMS (72.7%), Hazardous Condition (9.7%), and Good Intent Call (5.7%).
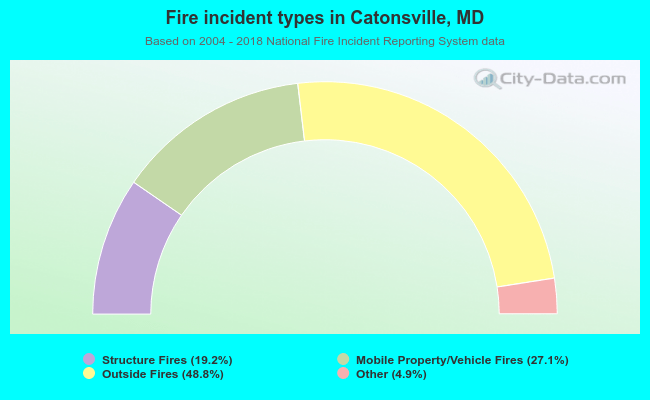 When looking into fire subcategories, the most reports belonged to: Outside Fires (48.8%), and Mobile Property/Vehicle Fires (27.1%).