Randallstown: Fire Incidents, Maryland (MD)
Where are fire incidents reported in Randallstown, MD
Something went wrong! Please refresh the page.
| Fire incidents reported | |
|---|---|
| Sreet name | Count |
| LIBERTY RD | 330 |
| OLD COURT RD | 114 |
| CARRIAGE HILL CIR | 98 |
| CHURCH LN | 54 |
| CINNAMON CIR | 48 |
| MARRIOTTSVILLE RD | 44 |
| OFFUTT RD | 38 |
| WINANDS RD | 38 |
| SOUTHALL RD | 32 |
| NOYES CIR | 30 |
| BRENBROOK DR | 28 |
| ROLLING RD | 28 |
| ALLENSWOOD RD | 26 |
| BRANCHLEIGH RD | 26 |
| CARLSON LN | 26 |
| ORPIN RD | 22 |
| GLEN MICHAEL LN | 20 |
| TWIN LAKES CT | 20 |
| BRICE RUN RD | 16 |
| GRANITE RD | 16 |
| LANGREHR RD | 16 |
| SCOTTS LEVEL RD | 16 |
| WINDSOR MILL RD | 16 |
| BARRY PAUL RD | 14 |
| SULKY CT | 14 |
| TENTMILL LN | 14 |
| BRAMBLE LN | 12 |
| DEER PARK RD | 12 |
| DOGWOOD RD | 12 |
| FERNSIDE RD | 12 |
2004 - 2018 National Fire Incident Reporting System (NFIRS) incidents
- Incident types reported to NFIRS in Randallstown, MD
- 19,44166.6%Rescue & EMS
- 3,52212.1%Hazardous Condition
- 1,7315.9%Good Intent Call
- 1,7115.9%False Alarm
- 1,5615.3%Service Call
- 1,1694.0%Fire
- 450.2%Overpressure Rupture
- Fire incident types reported to NFIRS in Randallstown, MD
- 51043.6%Outside Fires
- 37432.0%Structure Fires
- 20117.2%Mobile Property/Vehicle Fires
- 847.2%Other
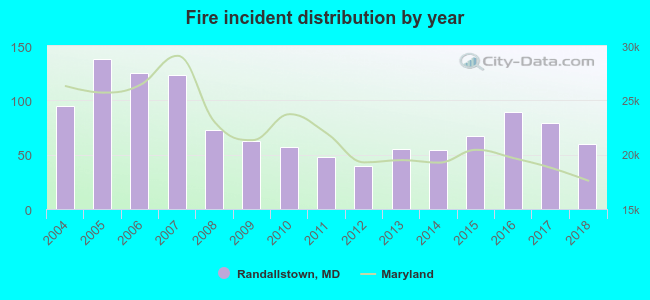 Based on the data from the years 2004 - 2018 the average number of fires per year is 78. The highest number of reported fire incidents - 138 took place in 2005, and the least - 40 in 2012. The data has a dropping trend.
The average number of yearly fire incidents per 10k residents in Randallstown, MD compared to nearest cities:
(Note: Based on data for the last 3 years, including only cities with population 5,000 and above)
| Randallstown: | 23.4 |
| Owings Mills: | 22.2 |
| Garrison: | 1.1 |
| Pikesville: | 21.3 |
| Reisterstown: | 22.8 |
| Ellicott City: | 18.3 |
| Catonsville: | 21.1 |
| Eldersburg: | 6.6 |
| Towson: | 13.6 |
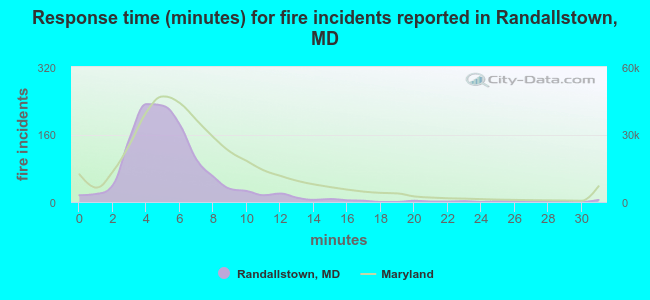 The median response time based on all reported fire incidents is 5 minutes. This is lower compared to the state median value.
The median response time in Randallstown, MD compared to nearest cities:
(Note: Based on data for all years, including only cities with at least 500 fire incidents)
| Randallstown: | 5 minutes |
| Owings Mills: | 6 minutes |
| Pikesville: | 5 minutes |
| Reisterstown: | 6 minutes |
| Ellicott City: | 7 minutes |
| Catonsville: | 5 minutes |
| Eldersburg: | 8 minutes |
| Sykesville: | 10 minutes |
| Towson: | 5 minutes |
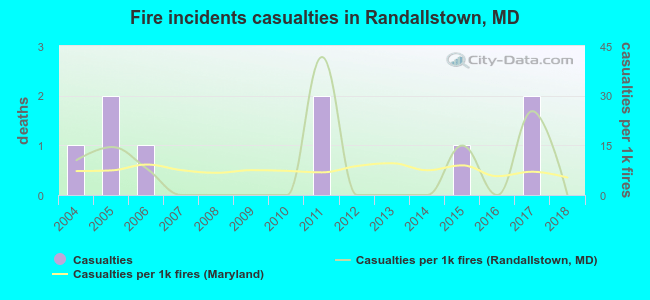 According to the reports from the years 2004 - 2018 the average number of fire-related casualties per year is 1. The highest number of injuries - 2 took place in 2005, and the lowest - 0 in 2007. The data has a dropping trend.
The average number of casualties per 1,000 fire incidents is 8. This indicator was the highest - 42 in 2011, and the lowest 0 in 2007. The trend for casualties per 1,000 fire incidents is decreasing. Compared to the Maryland value the number of casualties per 1,000 fires is similar.
According to the reports from the years 2004 - 2018 the average number of fire-related casualties per year is 1. The highest number of injuries - 2 took place in 2005, and the lowest - 0 in 2007. The data has a dropping trend.
The average number of casualties per 1,000 fire incidents is 8. This indicator was the highest - 42 in 2011, and the lowest 0 in 2007. The trend for casualties per 1,000 fire incidents is decreasing. Compared to the Maryland value the number of casualties per 1,000 fires is similar.Casualties per 1,000 incidents in Randallstown, MD compared to nearest cities:
(Note: Based on data for all years, including only cities with at least 500 fire incidents)
| Randallstown: | 7.7 |
| Owings Mills: | 4.6 |
| Pikesville: | 4.2 |
| Reisterstown: | 1.0 |
| Ellicott City: | 15.5 |
| Catonsville: | 3.5 |
| Eldersburg: | 9.4 |
| Sykesville: | 8.6 |
| Towson: | 2.9 |
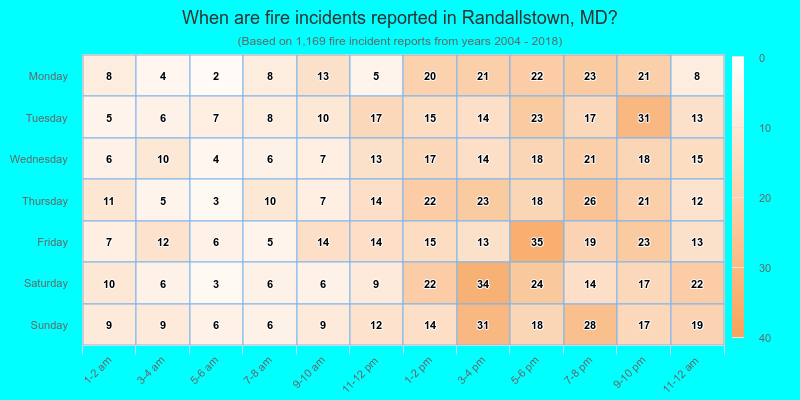
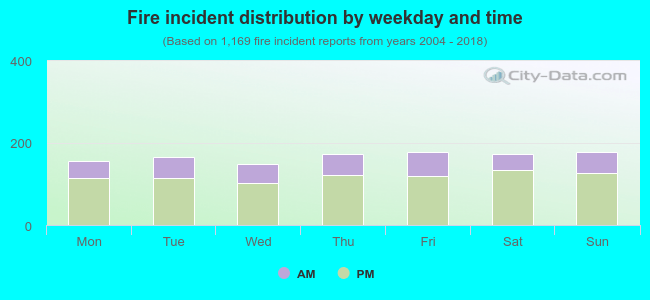 28.9% incidents where reported in the morning and 71.1% in the evening. The most fires (15.2%) took place on Sunday, and the least (12.7%) on Wednesday.
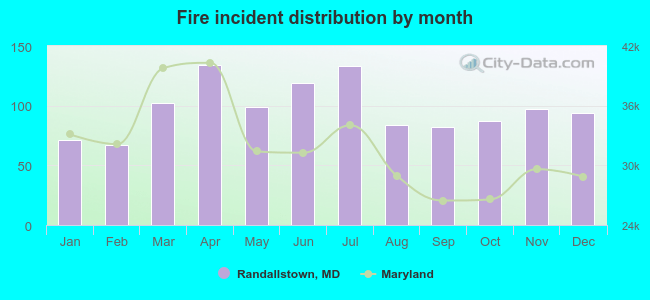 Based on the 1,169 incident reports from years 2004 - 2018 most fires (11.5%) took place during April, and the least (5.7%) in February.
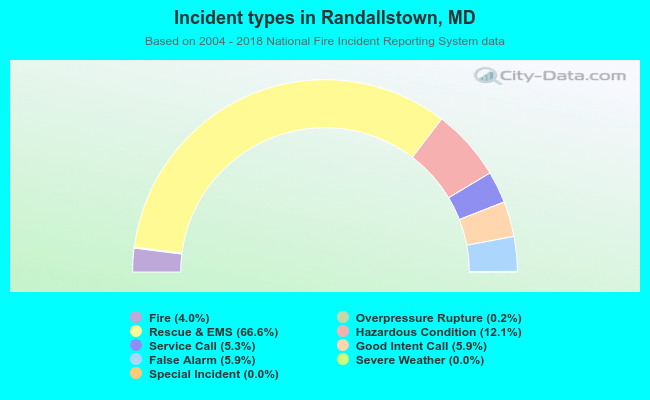 Out of all 29,195 cases reported during the years 2004 - 2018, the most belonged to the categories: Rescue & EMS (66.6%), Hazardous Condition (12.1%), and Good Intent Call (5.9%).
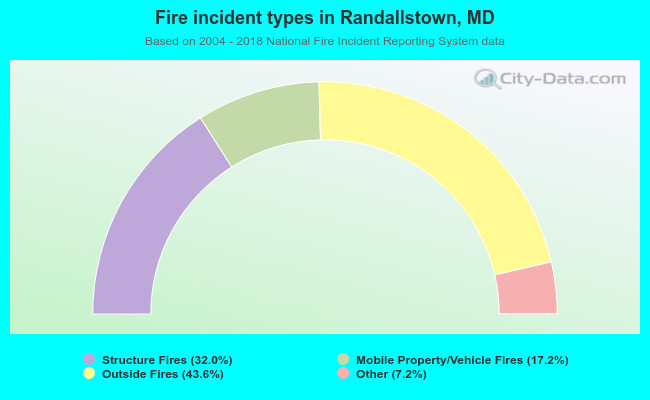 When looking into fire subcategories, the most incidents belonged to: Outside Fires (43.6%), and Structure Fires (32.0%).