Eldersburg: Fire Incidents, Maryland (MD)
Where are fire incidents reported in Eldersburg, MD
Something went wrong! Please refresh the page.
| Fire incidents reported | |
|---|---|
| Sreet name | Count |
| LIBERTY RD | 122 |
| RIDGE RD | 68 |
| SYKESVILLE RD | 58 |
| BARTHOLOW RD | 32 |
| LONDONTOWN BLVD | 32 |
| SYKESVILLE ROAD (32) | 30 |
| GAITHER RD | 28 |
| HOODS MILL RD | 20 |
| OLD WASHINGTON RD | 20 |
| FREDERICK RD | 18 |
| GEORGETOWN BLVD | 18 |
| HENRYTON RD | 18 |
| HODGES RD | 18 |
| MARRIOTTSVILLE RD | 18 |
| OAKLAND MILLS RD | 18 |
| ROUTE 32 | 18 |
| MACBETH WAY | 16 |
| MINERAL HILL RD | 16 |
| ROUTE 97 HWY | 16 |
| JOHNSVILLE RD | 14 |
| MELSTONE VALLEY WAY | 14 |
| OBRECHT RD | 14 |
| WOODBINE RD | 14 |
| FREEDOM AVE | 12 |
| OLD FREDERICK RD | 12 |
| OLD LIBERTY RD | 12 |
| THIRD AVE | 12 |
| ARTHUR AVE | 10 |
| BUCKHORN RD | 10 |
| CARROLL HIGHLANDS RD | 10 |
| Other | 129 |
2003 - 2018 National Fire Incident Reporting System (NFIRS) incidents
- Incident types reported to NFIRS in Eldersburg, MD
- 1,44036.7%Rescue & EMS
- 84721.6%Fire
- 74819.1%Hazardous Condition
- 39610.1%Good Intent Call
- 2947.5%False Alarm
- 1674.3%Service Call
- 170.4%Overpressure Rupture
- 100.3%Severe Weather
- Fire incident types reported to NFIRS in Eldersburg, MD
- 43050.8%Structure Fires
- 28033.1%Outside Fires
- 8710.3%Mobile Property/Vehicle Fires
- 505.9%Other
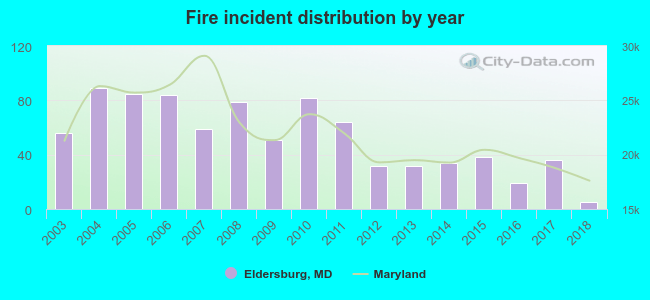 According to the data from the years 2003 - 2018 the average number of fire incidents per year is 53. The highest number of reported fires - 89 took place in 2004, and the least - 5 in 2018. The data has a dropping trend.
The average number of yearly fire incidents per 10k residents in Eldersburg, MD compared to nearest cities:
(Note: Based on data for the last 3 years, including only cities with population 5,000 and above)
| Eldersburg: | 6.6 |
| Reisterstown: | 22.8 |
| Randallstown: | 23.4 |
| Owings Mills: | 22.2 |
| Garrison: | 1.1 |
| Mount Airy: | 65.0 |
| Ellicott City: | 18.3 |
| Westminster: | 151.0 |
| Pikesville: | 21.3 |
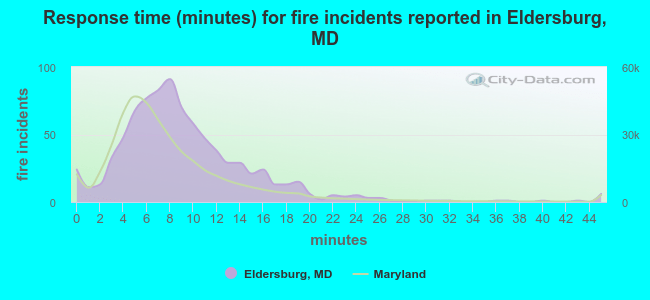 The median response time based on all reported fire incidents is 8 minutes. This is about the same as the state median value.
The median response time in Eldersburg, MD compared to nearest cities:
(Note: Based on data for all years, including only cities with at least 500 fire incidents)
| Eldersburg: | 8 minutes |
| Sykesville: | 10 minutes |
| Reisterstown: | 6 minutes |
| Randallstown: | 5 minutes |
| Owings Mills: | 6 minutes |
| Mount Airy: | 13 minutes |
| Ellicott City: | 7 minutes |
| Westminster: | 10 minutes |
| New Windsor: | 11 minutes |
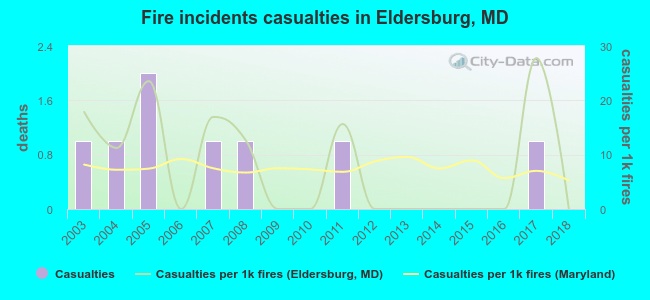 Based on the data from the years 2003 - 2018 the average number of fire-related casualties per year is 1. The highest number of casualties - 2 took place in 2005, and the lowest - 0 in 2006. The data has a decreasing trend.
The average number of casualties per 1,000 fires is 8. This indicator was the highest - 28 in 2017, and the lowest 0 in 2006. The trend for injuries per 1,000 fires is dropping. Compared to the Maryland value the number of casualties per 1,000 fires is higher.
Based on the data from the years 2003 - 2018 the average number of fire-related casualties per year is 1. The highest number of casualties - 2 took place in 2005, and the lowest - 0 in 2006. The data has a decreasing trend.
The average number of casualties per 1,000 fires is 8. This indicator was the highest - 28 in 2017, and the lowest 0 in 2006. The trend for injuries per 1,000 fires is dropping. Compared to the Maryland value the number of casualties per 1,000 fires is higher.Casualties per 1,000 incidents in Eldersburg, MD compared to nearest cities:
(Note: Based on data for all years, including only cities with at least 500 fire incidents)
| Eldersburg: | 9.4 |
| Sykesville: | 8.6 |
| Reisterstown: | 1.0 |
| Randallstown: | 7.7 |
| Owings Mills: | 4.6 |
| Mount Airy: | 0.0 |
| Ellicott City: | 15.5 |
| Westminster: | 2.3 |
| New Windsor: | 0.0 |
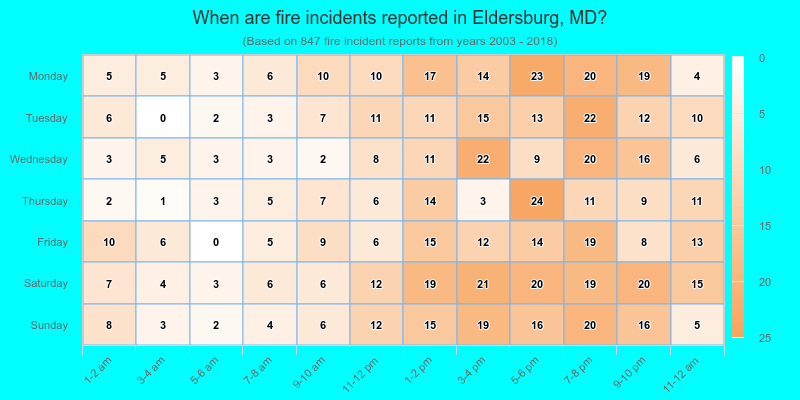
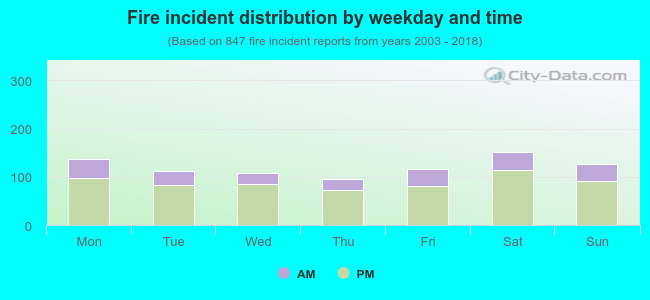 26.6% incidents where reported in the morning and 73.4% in the evening. The most fires (17.9%) took place on Saturday, and the least (11.3%) on Thursday.
 According to the 847 fire incidents from years 2003 - 2018 most fires (12.3%) took place during March, and the least (6.6%) in September.
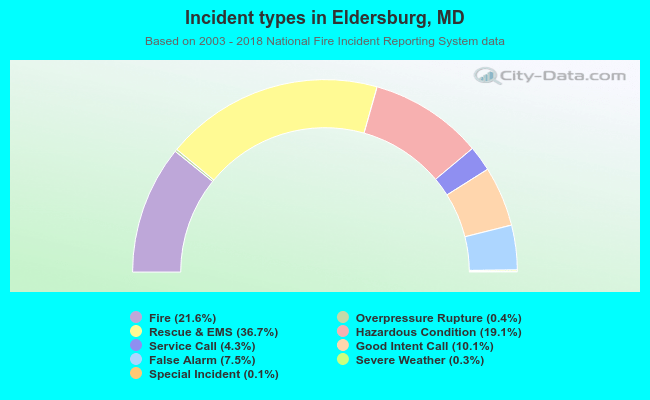 Out of all 3,922 cases reported during the years 2003 - 2018, the most belonged to the categories: Rescue & EMS (36.7%), Fire (21.6%), and Hazardous Condition (19.1%).
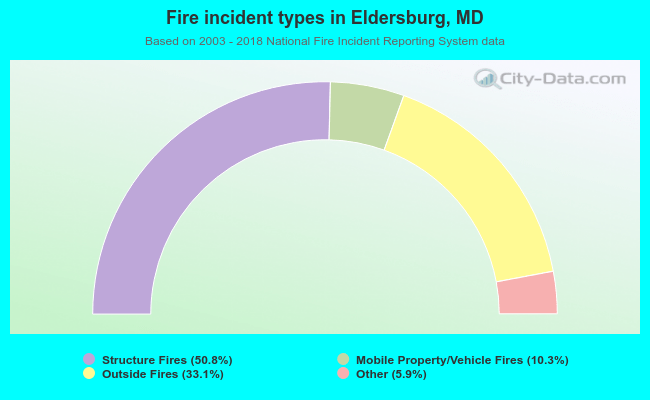 When looking into fire subcategories, the most incidents belonged to: Structure Fires (50.8%), and Outside Fires (33.1%).