Westminster: Fire Incidents, Maryland (MD)
Where are fire incidents reported in Westminster, MD
Something went wrong! Please refresh the page.
| Fire incidents reported | |
|---|---|
| Sreet name | Count |
| MAIN ST | 500 |
| BALTIMORE BLVD | 358 |
| CENTER ST | 240 |
| LITTLESTOWN PIKE | 210 |
| PENNSYLVANIA AVE | 200 |
| WASHINGTON RD | 186 |
| ROUTE 140 HWY | 162 |
| RIDGE RD | 138 |
| GORSUCH RD | 108 |
| WESTERN CHAPEL RD | 106 |
| ENGLAR RD | 104 |
| LIBERTY ST | 102 |
| OLD WESTMINSTER PIKE | 100 |
| SALEM BOTTOM RD | 100 |
| HUGHES SHOP RD | 86 |
| ROUTE 27 HWY | 84 |
| UNIONTOWN (84) RD | 84 |
| GREEN ST | 80 |
| DEER PARK RD | 78 |
| OLD MANCHESTER RD | 76 |
| SULLIVAN RD | 74 |
| SYKESVILLE ROAD (32) | 74 |
| JOHAHN DR | 72 |
| STONE RD | 68 |
| HOOK RD | 66 |
| CHURCH ST | 62 |
| OLD HANOVER RD | 62 |
| OLD TANEYTOWN RD | 60 |
| BACHMAN VALLEY RD | 56 |
| CHARLES ST | 56 |
| Other | 1,479 |
2002 - 2018 National Fire Incident Reporting System (NFIRS) incidents
- Incident types reported to NFIRS in Westminster, MD
- 12,58544.1%Rescue & EMS
- 5,23118.3%Fire
- 4,86317.0%Good Intent Call
- 3,29211.5%Hazardous Condition
- 1,2834.5%False Alarm
- 1,1414.0%Service Call
- 670.2%Overpressure Rupture
- 670.2%Severe Weather
- Fire incident types reported to NFIRS in Westminster, MD
- 3,28962.9%Structure Fires
- 1,20323.0%Outside Fires
- 3997.6%Mobile Property/Vehicle Fires
- 3406.5%Other
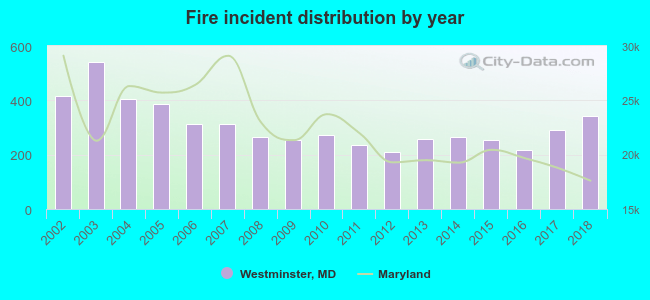 Based on the data from the years 2002 - 2018 the average number of fires per year is 308. The highest number of reported fire incidents - 541 took place in 2003, and the least - 211 in 2012. The data has a dropping trend.
The average number of yearly fire incidents per 10k residents in Westminster, MD compared to nearest cities:
(Note: Based on data for the last 3 years, including only cities with population 5,000 and above)
| Westminster: | 151.0 |
| Hampstead: | 91.2 |
| Taneytown: | 88.4 |
| Eldersburg: | 6.6 |
| Reisterstown: | 22.8 |
| Owings Mills: | 22.2 |
| Mount Airy: | 65.0 |
| Randallstown: | 23.4 |
| Garrison: | 1.1 |
 The median response time based on all reported fire incidents is 10 minutes. This is higher than the state median value.
The median response time in Westminster, MD compared to nearest cities:
(Note: Based on data for all years, including only cities with at least 500 fire incidents)
| Westminster: | 10 minutes |
| New Windsor: | 11 minutes |
| Hampstead: | 10 minutes |
| Manchester: | 10 minutes |
| Union Bridge: | 11 minutes |
| Taneytown: | 12 minutes |
| Eldersburg: | 8 minutes |
| Reisterstown: | 6 minutes |
| Sykesville: | 10 minutes |
 Based on the data from the years 2002 - 2018 the average number of fire-related yearly deaths is 0. The highest number of deaths - 1 took place in 2011, and the lowest - 0 in 2002. The data has a constant trend.
The average number of fatalities per 1,000 fire incidents is 1. This indicator was the highest - 4 in 2011, and the lowest 0 in 2002. The trend for deaths per 1,000 incidents is constant. Compared to the Maryland value the number of deaths per 1,000 incidents is much lower.
Based on the data from the years 2002 - 2018 the average number of fire-related yearly deaths is 0. The highest number of deaths - 1 took place in 2011, and the lowest - 0 in 2002. The data has a constant trend.
The average number of fatalities per 1,000 fire incidents is 1. This indicator was the highest - 4 in 2011, and the lowest 0 in 2002. The trend for deaths per 1,000 incidents is constant. Compared to the Maryland value the number of deaths per 1,000 incidents is much lower.Deaths per 1,000 incidents in Westminster, MD compared to nearest cities:
(Note: Based on data for all years, including only cities with at least 2,500 fire incidents)
| Westminster: | 0.6 |
| Frederick: | 0.4 |
 Based on the reports from the years 2002 - 2018 the average number of fire-related casualties per year is 1. The highest number of injuries - 3 took place in 2003, and the lowest - 0 in 2002. The data has a constant trend.
The average number of injuries per 1,000 fire incidents is 2. This indicator was the highest - 10 in 2006, and the lowest 0 in 2002. The trend for casualties per 1,000 fires is rising. Compared to the state value the number of injuries per 1,000 fire incidents is much lower.
Based on the reports from the years 2002 - 2018 the average number of fire-related casualties per year is 1. The highest number of injuries - 3 took place in 2003, and the lowest - 0 in 2002. The data has a constant trend.
The average number of injuries per 1,000 fire incidents is 2. This indicator was the highest - 10 in 2006, and the lowest 0 in 2002. The trend for casualties per 1,000 fires is rising. Compared to the state value the number of injuries per 1,000 fire incidents is much lower.Casualties per 1,000 incidents in Westminster, MD compared to nearest cities:
(Note: Based on data for all years, including only cities with at least 500 fire incidents)
| Westminster: | 2.3 |
| New Windsor: | 0.0 |
| Hampstead: | 3.2 |
| Manchester: | 1.1 |
| Union Bridge: | 0.0 |
| Taneytown: | 1.0 |
| Eldersburg: | 9.4 |
| Reisterstown: | 1.0 |
| Sykesville: | 8.6 |
 33.4% incidents where reported in the morning and 66.6% in the evening. The most fires (16.4%) took place on Saturday, and the least (13.1%) on Wednesday.
 Based on the 5,231 reports from years 2002 - 2018 most fires (12.1%) took place during March, and the least (6.1%) in September.
 Out of all 28,539 cases reported during the years 2002 - 2018, the most belonged to the categories: Rescue & EMS (44.1%), Fire (18.3%), and Good Intent Call (17.0%).
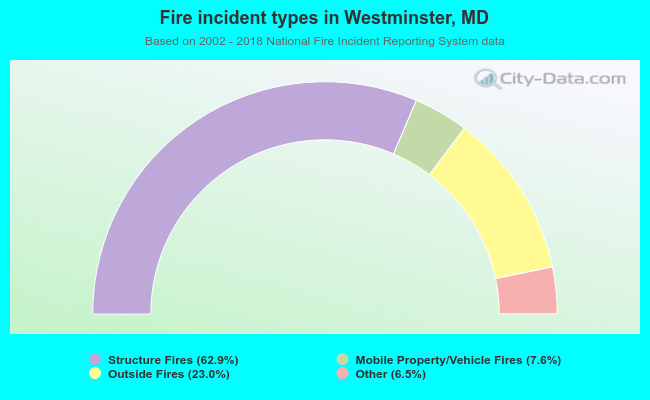 When looking into fire subcategories, the most reports belonged to: Structure Fires (62.9%), and Outside Fires (23.0%).