Glen Burnie: Fire Incidents, Maryland (MD)
Where are fire incidents reported in Glen Burnie, MD
Something went wrong! Please refresh the page.
| Fire incidents reported | |
|---|---|
| Sreet name | Count |
| RITCHIE HWY | 330 |
| CRAIN HWY | 202 |
| FURNACE BRANCH RD | 76 |
| BALTIMORE ANNAPOLIS BLVD | 68 |
| I97 | 58 |
| OAKWOOD RD | 56 |
| AMERICANA CIR | 52 |
| HOSPITAL DR | 48 |
| DORSEY RD | 46 |
| TALL PINES CT | 46 |
| WARWICKSHIRE LN | 46 |
| BALTO ANNAP BLVD | 42 |
| MOUNTAIN RD | 40 |
| ORDNANCE RD | 36 |
| OLD STAGE RD | 34 |
| HIGHLAND DR | 32 |
| NOLFIELD DR | 32 |
| WELLHAM AVE | 28 |
| GLENRIDGE CIR | 26 |
| MOUNTAIN RIDGE CT | 26 |
| NOLPARK CT | 26 |
| RT100 | 26 |
| I695 | 24 |
| PHIRNE RD | 24 |
| QUARTERFIELD RD | 24 |
| WOODHILL DR | 24 |
| HAMMARLEE RD | 22 |
| MARLEY NECK RD | 22 |
| RT10 | 22 |
| MARLEY NECK BLVD | 20 |
| Other | 1,129 |
2008 - 2018 National Fire Incident Reporting System (NFIRS) incidents
- Incident types reported to NFIRS in Glen Burnie, MD
- 29,82865.3%Rescue & EMS
- 5,02911.0%Good Intent Call
- 3,2187.0%Hazardous Condition
- 3,1026.8%Service Call
- 2,6875.9%Fire
- 1,6803.7%False Alarm
- 910.2%Special Incident
- 530.1%Overpressure Rupture
- Fire incident types reported to NFIRS in Glen Burnie, MD
- 1,17243.6%Structure Fires
- 97936.4%Outside Fires
- 45016.7%Mobile Property/Vehicle Fires
- 863.2%Other
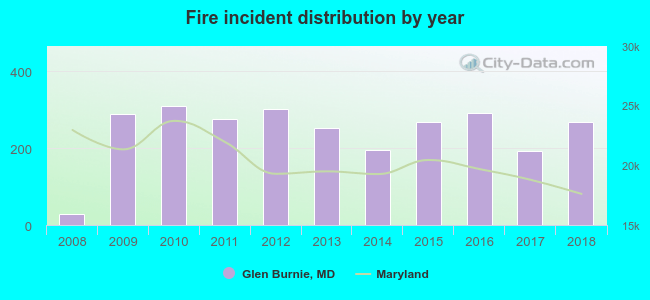 Based on the data from the years 2008 - 2018 the average number of fire incidents per year is 243. The highest number of fire incidents - 310 took place in 2010, and the least - 28 in 2008. The data has an increasing trend.
The average number of yearly fire incidents per 10k residents in Glen Burnie, MD compared to nearest cities:
(Note: Based on data for the last 3 years, including only cities with population 5,000 and above)
| Glen Burnie: | 36.9 |
| Ferndale: | 1.6 |
| Linthicum: | 31.6 |
| Brooklyn Park: | 5.3 |
| Pasadena: | 36.1 |
| Severn: | 16.1 |
| Severna Park: | 10.5 |
| Lansdowne: | 2.4 |
| Arbutus: | 19.4 |
 The median response time based on all reported fire incidents is 6 minutes. This is comparable to the Maryland median value.
The median response time in Glen Burnie, MD compared to nearest cities:
(Note: Based on data for all years, including only cities with at least 500 fire incidents)
| Glen Burnie: | 6 minutes |
| Pasadena: | 6 minutes |
| Severn: | 7 minutes |
| Arbutus: | 5 minutes |
| Odenton: | 7 minutes |
| Elkridge: | 7 minutes |
| Jessup: | 7 minutes |
| Dundalk: | 5 minutes |
| Edgemere: | 5 minutes |
 Based on the data from the years 2008 - 2018 the average number of fire-related fatalities per year is 0. The highest number of reported deaths - 2 took place in 2010, and the lowest - 0 in 2008. The data has a constant trend.
The average number of deaths per 1,000 fire incidents is 1. This indicator was the highest - 6 in 2010, and the lowest 0 in 2008. The trend for deaths per 1,000 fire incidents is constant. Compared to the state value the number of deaths per 1,000 fires is about the same.
Based on the data from the years 2008 - 2018 the average number of fire-related fatalities per year is 0. The highest number of reported deaths - 2 took place in 2010, and the lowest - 0 in 2008. The data has a constant trend.
The average number of deaths per 1,000 fire incidents is 1. This indicator was the highest - 6 in 2010, and the lowest 0 in 2008. The trend for deaths per 1,000 fire incidents is constant. Compared to the state value the number of deaths per 1,000 fires is about the same.
 According to the data from the years 2008 - 2018 the average number of fire-related yearly casualties is 3. The highest number of reported casualties - 8 took place in 2012, and the lowest - 0 in 2008. The data has a rising trend.
The average number of casualties per 1,000 fires is 12. This indicator was the highest - 26 in 2012, and the lowest 0 in 2008. The trend for injuries per 1,000 fires is increasing. Compared to the state value the number of injuries per 1,000 fires is higher.
According to the data from the years 2008 - 2018 the average number of fire-related yearly casualties is 3. The highest number of reported casualties - 8 took place in 2012, and the lowest - 0 in 2008. The data has a rising trend.
The average number of casualties per 1,000 fires is 12. This indicator was the highest - 26 in 2012, and the lowest 0 in 2008. The trend for injuries per 1,000 fires is increasing. Compared to the state value the number of injuries per 1,000 fires is higher.
 28.3% incidents where reported in the morning and 71.7% in the evening. The most fires (16.7%) took place on Sunday, and the least (13.0%) on Tuesday.
 According to the 2,687 reports from years 2008 - 2018 most fires (12.8%) took place during April, and the least (6.0%) in December.
 Out of all 45,696 cases reported during the years 2008 - 2018, the most belonged to the categories: Rescue & EMS (65.3%), Good Intent Call (11.0%), and Hazardous Condition (7.0%).
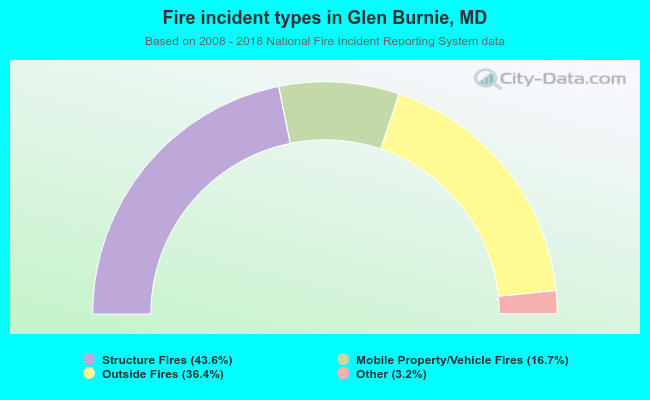 When looking into fire subcategories, the most incidents belonged to: Structure Fires (43.6%), and Outside Fires (36.4%).