Dundalk: Fire Incidents, Maryland (MD)
Where are fire incidents reported in Dundalk, MD
Something went wrong! Please refresh the page.
| Fire incidents reported | |
|---|---|
| Sreet name | Count |
| MERRITT BLVD | 150 |
| YORKWAY | 78 |
| FOUR GEORGES CT | 64 |
| SOLLERS POINT RD | 64 |
| WISE AVE | 60 |
| KAVANAGH RD | 54 |
| WISE AV | 54 |
| GERMAN HILL RD | 50 |
| NORTHPOINT BLVD | 50 |
| DUNDALK AVE | 48 |
| DUNMANWAY | 48 |
| WILLOW SPRING RD | 48 |
| LYNCH RD | 44 |
| HOLABIRD AV | 40 |
| COLLINGHAM DR | 36 |
| WALLFORD DR | 36 |
| CHURCH RD | 34 |
| DUNDALK AV | 34 |
| MELBOURNE RD | 34 |
| STANSBURY RD | 34 |
| TRAPPE RD | 34 |
| DELVALE AV | 32 |
| BROENING HWY | 28 |
| EASTERN BLVD | 26 |
| PLAYFIELD ST | 26 |
| CENTER PL | 24 |
| CORNWALL RD | 22 |
| LIBERTY PY | 22 |
| PARK HAVEN RD | 22 |
| PENINSULA XY | 22 |
| Other | 186 |
2004 - 2018 National Fire Incident Reporting System (NFIRS) incidents
- Incident types reported to NFIRS in Dundalk, MD
- 30,01280.2%Rescue & EMS
- 2,9147.8%Hazardous Condition
- 1,5044.0%Fire
- 1,1022.9%Service Call
- 1,0732.9%Good Intent Call
- 7942.1%False Alarm
- Fire incident types reported to NFIRS in Dundalk, MD
- 92861.7%Outside Fires
- 27518.3%Structure Fires
- 22615.0%Mobile Property/Vehicle Fires
- 755.0%Other
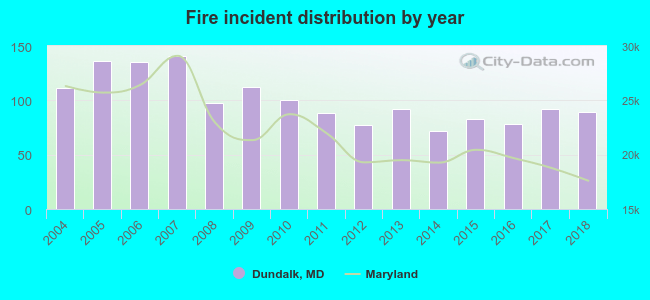 According to the data from the years 2004 - 2018 the average number of fires per year is 100. The highest number of reported fires - 141 took place in 2007, and the least - 72 in 2014. The data has a decreasing trend.
The average number of yearly fire incidents per 10k residents in Dundalk, MD compared to nearest cities:
(Note: Based on data for the last 3 years, including only cities with population 5,000 and above)
| Dundalk: | 13.6 |
| Edgemere: | 34.6 |
| Essex: | 24.5 |
| Rosedale: | 19.7 |
| Middle River: | 43.3 |
| Brooklyn Park: | 5.3 |
| Baltimore: | 47.1 |
| Parkville: | 23.6 |
| Lansdowne: | 2.4 |
 The median response time based on all reported fire incidents is 5 minutes. This is lower compared to the Maryland median value.
The median response time in Dundalk, MD compared to nearest cities:
(Note: Based on data for all years, including only cities with at least 500 fire incidents)
| Dundalk: | 5 minutes |
| Edgemere: | 5 minutes |
| Essex: | 5 minutes |
| Middle River: | 5 minutes |
| Baltimore: | 6 minutes |
| Parkville: | 5 minutes |
| Glen Burnie: | 6 minutes |
| Arbutus: | 5 minutes |
| Towson: | 5 minutes |
 According to the data from the years 2004 - 2018 the average number of fire-related yearly casualties is 1. The highest number of injuries - 4 took place in 2005, and the lowest - 0 in 2004. The data has a growing trend.
The average number of injuries per 1,000 fire incidents is 6. This indicator was the highest - 29 in 2005, and the lowest 0 in 2004. The trend for injuries per 1,000 fires is increasing. Compared to the Maryland value the number of casualties per 1,000 fires is lower.
According to the data from the years 2004 - 2018 the average number of fire-related yearly casualties is 1. The highest number of injuries - 4 took place in 2005, and the lowest - 0 in 2004. The data has a growing trend.
The average number of injuries per 1,000 fire incidents is 6. This indicator was the highest - 29 in 2005, and the lowest 0 in 2004. The trend for injuries per 1,000 fires is increasing. Compared to the Maryland value the number of casualties per 1,000 fires is lower.Casualties per 1,000 incidents in Dundalk, MD compared to nearest cities:
(Note: Based on data for all years, including only cities with at least 500 fire incidents)
| Dundalk: | 6.0 |
| Edgemere: | 6.1 |
| Essex: | 4.9 |
| Middle River: | 2.7 |
| Baltimore: | 11.4 |
| Parkville: | 6.2 |
| Glen Burnie: | 14.1 |
| Arbutus: | 1.5 |
| Towson: | 2.9 |
 29.3% incidents where reported in the morning and 70.7% in the evening. The most fires (17.1%) took place on Saturday, and the least (11.8%) on Friday.
 According to the 1,504 reports from years 2004 - 2018 most fires (11.3%) took place during July, and the least (6.3%) in September.
 Out of all 37,440 cases reported during the years 2004 - 2018, the most belonged to the categories: Rescue & EMS (80.2%), Hazardous Condition (7.8%), and Fire (4.0%).
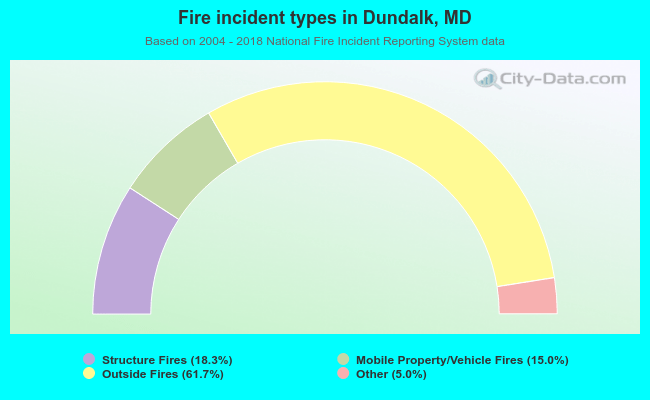 When looking into fire subcategories, the most reports belonged to: Outside Fires (61.7%), and Structure Fires (18.3%).