Savage: Fire Incidents, Maryland (MD)
Where are fire incidents reported in Savage, MD
Something went wrong! Please refresh the page.
|
| |||||||||||||||||||||||||||||||||||||||||||||||||||||||||||||||||||||||||||||||||||||||||||||||||||||||||||||
2002 - 2018 National Fire Incident Reporting System (NFIRS) incidents
- Incident types reported to NFIRS in Savage, MD
- 1,29160.6%Rescue & EMS
- 22210.4%Good Intent Call
- 1828.5%Hazardous Condition
- 1627.6%Fire
- 1386.5%False Alarm
- 1296.1%Service Call
- 40.2%Overpressure Rupture
- 30.1%Special Incident
- Fire incident types reported to NFIRS in Savage, MD
- 7445.7%Structure Fires
- 4930.2%Outside Fires
- 3521.6%Mobile Property/Vehicle Fires
- 42.5%Other
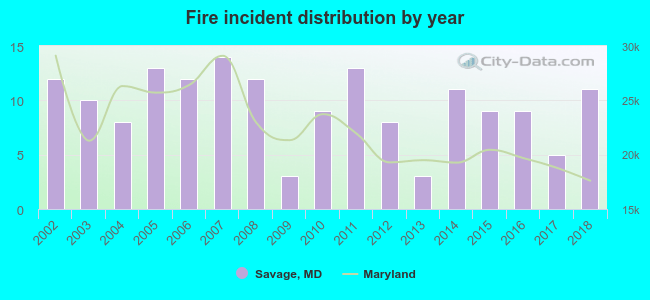 Based on the data from the years 2002 - 2018 the average number of fires per year is 10. The highest number of fires - 14 took place in 2007, and the least - 3 in 2009. The data has a dropping trend.
The average number of yearly fire incidents per 10k residents in Savage, MD compared to nearest cities:
(Note: Based on data for the last 3 years, including only cities with population 5,000 and above)
| Savage: | 11.8 |
| Jessup: | 52.3 |
| Maryland City: | 5.2 |
| Laurel: | 61.4 |
| Scaggsville: | 0.4 |
| Columbia: | 18.9 |
| Fort Meade: | 1.8 |
| Elkridge: | 60.5 |
| Burtonsville: | 30.0 |
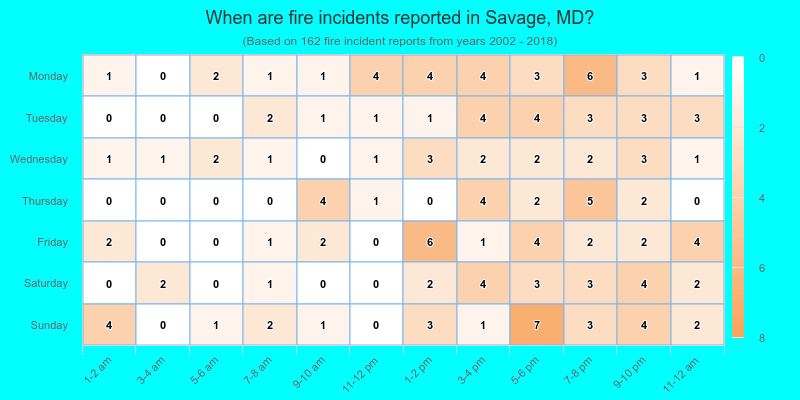
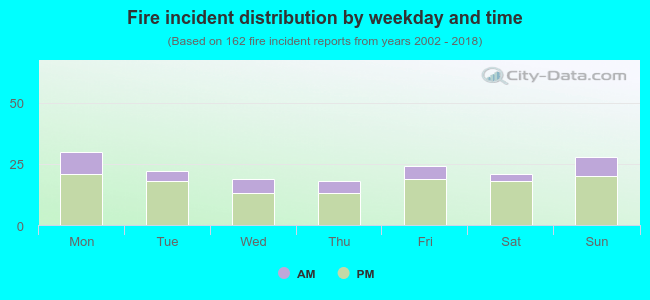 24.7% incidents where reported in the morning and 75.3% in the evening. The most fires (18.5%) took place on Monday, and the least (11.1%) on Thursday.
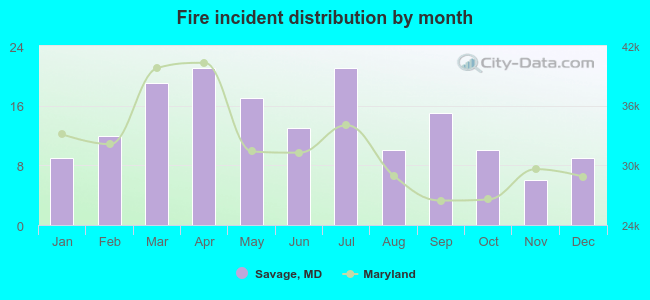 Based on the 162 fire incident reports from years 2002 - 2018 most fires (13.0%) took place during April, and the least (3.7%) in November.
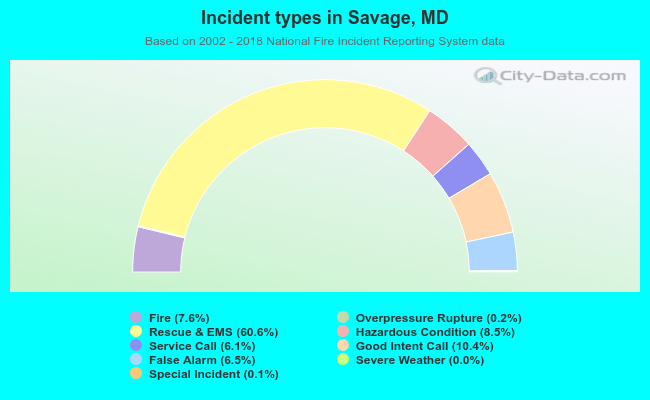 Out of all 2,132 cases reported during the years 2002 - 2018, the most belonged to the categories: Rescue & EMS (60.6%), Good Intent Call (10.4%), and Hazardous Condition (8.5%).
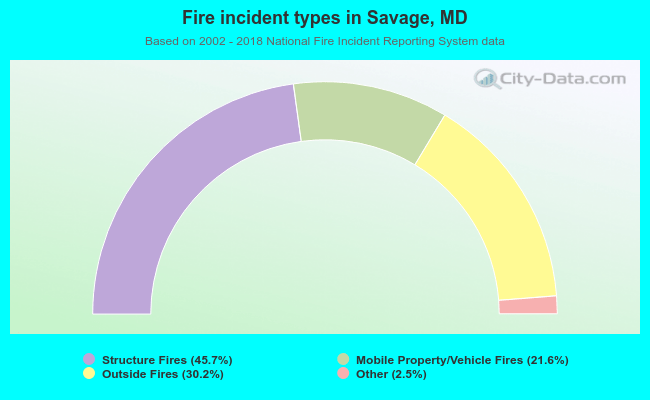 When looking into fire subcategories, the most incidents belonged to: Structure Fires (45.7%), and Outside Fires (30.2%).