Burtonsville: Fire Incidents, Maryland (MD)
Where are fire incidents reported in Burtonsville, MD
Something went wrong! Please refresh the page.
|
| |||||||||||||||||||||||||||||||||||||||||||||||||||||||||||||||||||||||||||||||||||||||||||||||||||||||||||||
| Other | 34 | |||||||||||||||||||||||||||||||||||||||||||||||||||||||||||||||||||||||||||||||||||||||||||||||||||||||||||||
2002 - 2018 National Fire Incident Reporting System (NFIRS) incidents
- Incident types reported to NFIRS in Burtonsville, MD
- 4,40465.9%Rescue & EMS
- 95914.3%Good Intent Call
- 3675.5%Hazardous Condition
- 3465.2%Fire
- 3154.7%Service Call
- 2804.2%False Alarm
- 90.1%Special Incident
- Fire incident types reported to NFIRS in Burtonsville, MD
- 13338.4%Outside Fires
- 13137.9%Structure Fires
- 6919.9%Mobile Property/Vehicle Fires
- 133.8%Other
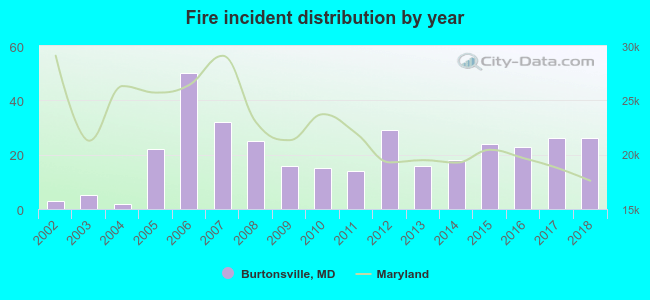 Based on the data from the years 2002 - 2018 the average number of fires per year is 20. The highest number of reported fires - 50 took place in 2006, and the least - 2 in 2004. The data has a rising trend.
The average number of yearly fire incidents per 10k residents in Burtonsville, MD compared to nearest cities:
(Note: Based on data for the last 3 years, including only cities with population 5,000 and above)
| Burtonsville: | 30.0 |
| Scaggsville: | 0.4 |
| Laurel: | 61.4 |
| Colesville: | 14.3 |
| Beltsville: | 17.5 |
| Maryland City: | 5.2 |
| Savage: | 11.8 |
| College Park: | 2.5 |
| Greenbelt: | 3.5 |

 Based on the reports from the years 2002 - 2018 the average number of fire-related casualties per year is 0. The highest number of injuries - 1 took place in 2006, and the lowest - 0 in 2002. The data has a constant trend.
 30.1% incidents where reported in the morning and 69.9% in the evening. The most fires (15.9%) took place on Tuesday, and the least (12.7%) on Friday.
 According to the 346 reports from years 2002 - 2018 most fires (15.6%) took place during April, and the least (5.2%) in December.
 Out of all 6,686 cases reported during the years 2002 - 2018, the most belonged to the categories: Rescue & EMS (65.9%), Good Intent Call (14.3%), and Hazardous Condition (5.5%).
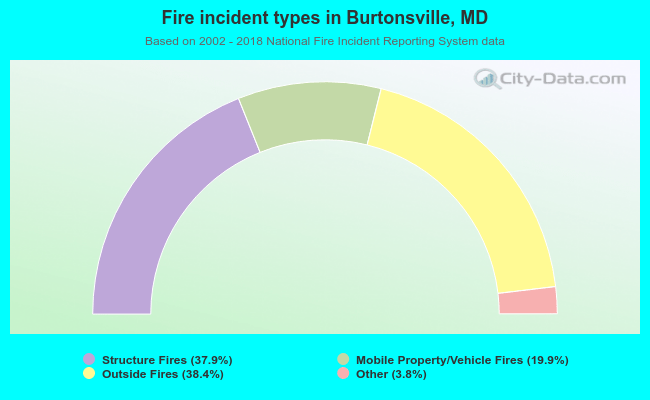 When looking into fire subcategories, the most incidents belonged to: Outside Fires (38.4%), and Structure Fires (37.9%).