Pike Road: Fire Incidents, Alabama (AL)
Where are fire incidents reported in Pike Road, AL
Something went wrong! Please refresh the page.
|
| |||||||||||||||||||||||||||||||||||||||||||||||||||||||||||||||||||||||||||||||||||||||||||||||||||||||||||||
2006 - 2018 National Fire Incident Reporting System (NFIRS) incidents
- Incident types reported to NFIRS in Pike Road, AL
- 1,56865.2%Rescue & EMS
- 28812.0%Fire
- 24010.0%Good Intent Call
- 1817.5%False Alarm
- 753.1%Service Call
- 301.2%Hazardous Condition
- 130.5%Severe Weather
- 60.2%Overpressure Rupture
- 30.1%Special Incident
- Fire incident types reported to NFIRS in Pike Road, AL
- 15553.8%Outside Fires
- 7626.4%Structure Fires
- 3712.8%Mobile Property/Vehicle Fires
- 206.9%Other
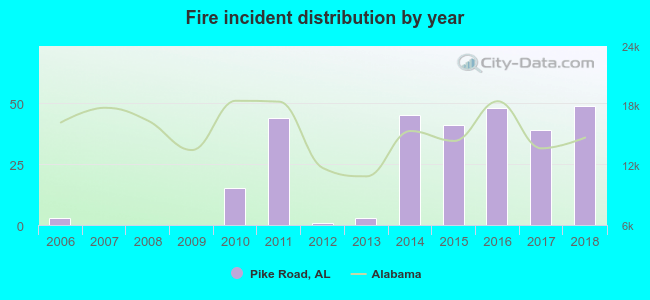 According to the data from the years 2006 - 2018 the average number of fires per year is 22. The highest number of reported fires - 49 took place in 2018, and the least - 0 in 2007. The data has a growing trend.
The average number of yearly fire incidents per 10k residents in Pike Road, AL compared to nearest cities:
(Note: Based on data for the last 3 years, including only cities with population 5,000 and above)
| Pike Road: | 57.1 |
| Montgomery: | 46.5 |
| Hope Hull: | 3.4 |
| Wetumpka: | 110.1 |
| Millbrook: | 27.7 |
| Prattville: | 34.6 |
| Titus: | 2.0 |
| Marbury: | 10.1 |
| Troy: | 51.4 |
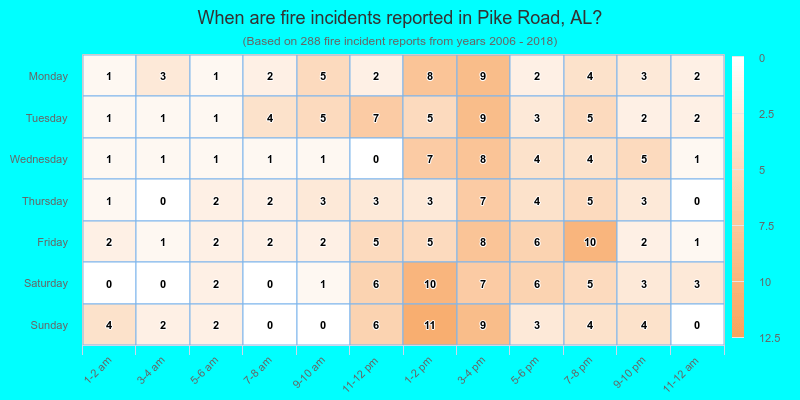
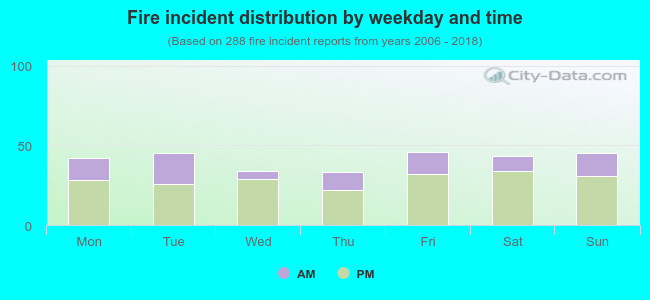 29.9% incidents where reported in the morning and 70.1% in the evening. The most fires (16.0%) took place on Friday, and the least (11.5%) on Thursday.
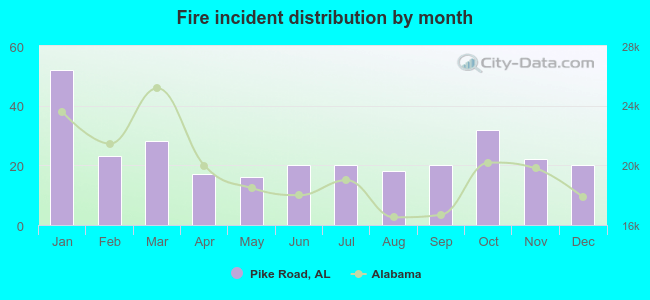 According to the 288 incident reports from years 2006 - 2018 most fires (18.1%) took place during January, and the least (5.6%) in May.
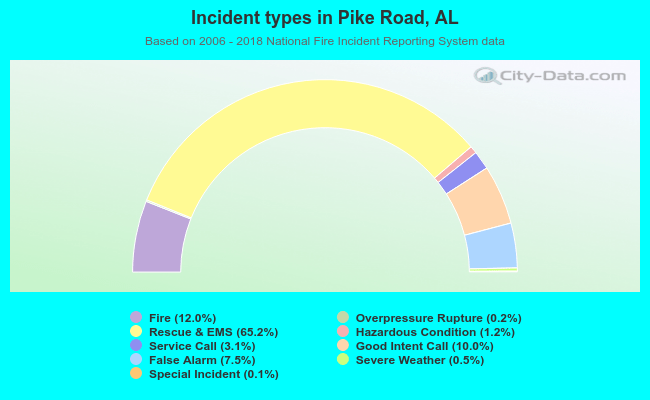 Out of all 2,404 cases reported during the years 2006 - 2018, the most belonged to the categories: Rescue & EMS (65.2%), Fire (12.0%), and Good Intent Call (10.0%).
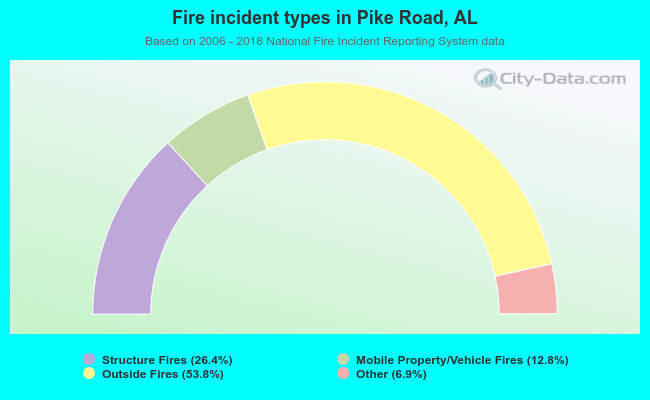 When looking into fire subcategories, the most incidents belonged to: Outside Fires (53.8%), and Structure Fires (26.4%).