Troy: Fire Incidents, Alabama (AL)
Where are fire incidents reported in Troy, AL
Something went wrong! Please refresh the page.
| Fire incidents reported | |
|---|---|
| Sreet name | Count |
| 231 HWY | 329 |
| THREE NOTCH ST | 91 |
| ELM ST | 78 |
| UNIVERSITY AVE | 76 |
| BRUNDIDGE ST | 71 |
| GIBBS ST | 62 |
| 231 S | 60 |
| PIKE COUNTY LAKE RD | 47 |
| US HIGHWAY 231 | 46 |
| BOTTS AVE | 43 |
| FOLMAR ST | 43 |
| 29 HWY | 42 |
| HIGHWAY 231 | 41 |
| ELBA HWY | 40 |
| US HWY 231 N | 40 |
| PARK ST | 38 |
| SANDERS RD | 38 |
| MONTGOMERY ST | 35 |
| HIGHWAY 87 | 33 |
| ACADEMY ST | 30 |
| HWY 231 | 30 |
| MONTGOMERY ST | 30 |
| SECOND AVE | 30 |
| PELL AVE | 29 |
| ARROWHEAD DR | 25 |
| ASTER AVE | 25 |
| ELBA HWY | 25 |
| ENZOR RD | 25 |
| HENDERSON DR | 25 |
| TATE ST | 25 |
2003 - 2018 National Fire Incident Reporting System (NFIRS) incidents
- Incident types reported to NFIRS in Troy, AL
- 8,09763.6%Rescue & EMS
- 1,27610.0%Fire
- 1,2179.6%Hazardous Condition
- 1,0077.9%False Alarm
- 5574.4%Service Call
- 5033.9%Good Intent Call
- 390.3%Special Incident
- 230.2%Overpressure Rupture
- 220.2%Severe Weather
- Fire incident types reported to NFIRS in Troy, AL
- 52140.8%Outside Fires
- 41632.6%Structure Fires
- 26020.4%Mobile Property/Vehicle Fires
- 796.2%Other
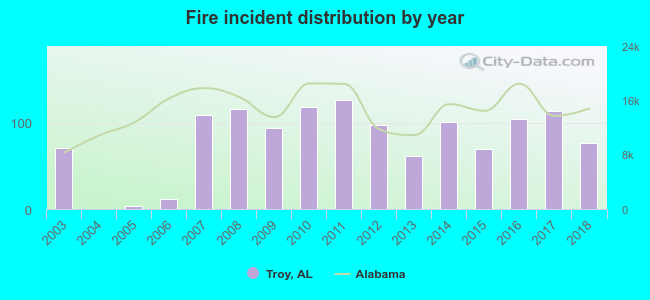 According to the data from the years 2003 - 2018 the average number of fires per year is 80. The highest number of reported fires - 126 took place in 2011, and the least - 0 in 2004. The data has an increasing trend.
The average number of yearly fire incidents per 10k residents in Troy, AL compared to nearest cities:
(Note: Based on data for the last 3 years, including only cities with population 5,000 and above)
| Troy: | 51.4 |
| Ozark: | 43.5 |
| Enterprise: | 34.8 |
| Pike Road: | 57.1 |
| Daleville: | 16.9 |
| Hope Hull: | 3.4 |
| Greenville: | 81.8 |
| Opp: | 85.9 |
| Montgomery: | 46.5 |
 The median response time based on all reported fire incidents is 5 minutes. This is lower compared to the state median value.
The median response time in Troy, AL compared to nearest cities:
(Note: Based on data for all years, including only cities with at least 500 fire incidents)
| Troy: | 5 minutes |
| Clayton: | 10 minutes |
| Ozark: | 5 minutes |
| Enterprise: | 4 minutes |
| Greenville: | 6 minutes |
| Opp: | 5 minutes |
| Montgomery: | 4 minutes |
| Samson: | 10 minutes |
 Based on the reports from the years 2003 - 2018 the average number of fire-related yearly casualties is 1. The highest number of reported casualties - 4 took place in 2003, and the lowest - 0 in 2004. The data has a decreasing trend.
The average number of casualties per 1,000 fire incidents is 6. This indicator was the highest - 56 in 2003, and the lowest 0 in 2004. The trend for injuries per 1,000 fire incidents is decreasing. Compared to the Alabama value the number of injuries per 1,000 incidents is similar.
Based on the reports from the years 2003 - 2018 the average number of fire-related yearly casualties is 1. The highest number of reported casualties - 4 took place in 2003, and the lowest - 0 in 2004. The data has a decreasing trend.
The average number of casualties per 1,000 fire incidents is 6. This indicator was the highest - 56 in 2003, and the lowest 0 in 2004. The trend for injuries per 1,000 fire incidents is decreasing. Compared to the Alabama value the number of injuries per 1,000 incidents is similar.Casualties per 1,000 incidents in Troy, AL compared to nearest cities:
(Note: Based on data for all years, including only cities with at least 500 fire incidents)
| Troy: | 6.3 |
| Clayton: | 3.9 |
| Ozark: | 2.8 |
| Enterprise: | 2.2 |
| Greenville: | 3.9 |
| Opp: | 0.0 |
| Montgomery: | 6.1 |
| Samson: | 0.0 |
 28.9% incidents where reported in the morning and 71.1% in the evening. The most fires (17.9%) took place on Saturday, and the least (12.6%) on Tuesday.
 Based on the 1,276 reports from years 2003 - 2018 most fires (12.3%) took place during January, and the least (5.2%) in August.
 Out of all 12,741 cases reported during the years 2003 - 2018, the most belonged to the categories: Rescue & EMS (63.6%), Fire (10.0%), and Hazardous Condition (9.6%).
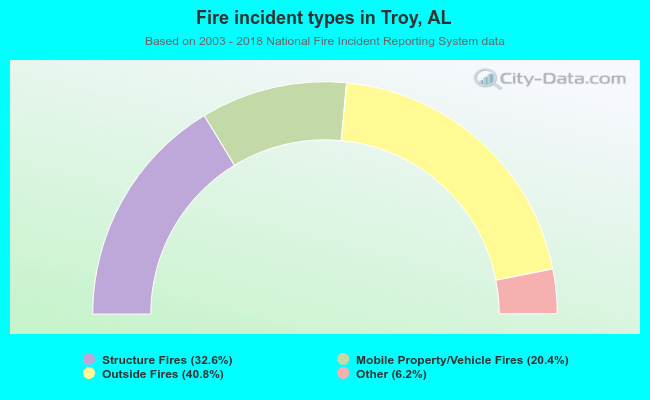 When looking into fire subcategories, the most incidents belonged to: Outside Fires (40.8%), and Structure Fires (32.6%).