Prattville: Fire Incidents, Alabama (AL)
Where are fire incidents reported in Prattville, AL
Something went wrong! Please refresh the page.
| Fire incidents reported | |
|---|---|
| Sreet name | Count |
| SOUTH MEMORIAL DRIVE | 369 |
| EAST MAIN STREET | 325 |
| COBBS FORD ROAD | 319 |
| I 65 SOUTH | 233 |
| I 65 NORTH | 160 |
| UPPER KINGSTON ROAD | 143 |
| COUNTY ROAD 4 EAST | 120 |
| FAIRVIEW AVENUE | 118 |
| DOSTER ROAD | 116 |
| I 65 | 109 |
| HIGHWAY 82 BYPASS EAST | 104 |
| HIGHWAY 14 EAST | 101 |
| EAST SIXTH STREET | 99 |
| HWY 31 NORTH | 98 |
| BRIARWOOD STREET | 97 |
| COVERED BRIDGE PARKWAY | 97 |
| MCQUEEN SMITH ROAD SOUTH | 96 |
| WEST FOURTH STREET | 89 |
| SHEILA BOULEVARD | 85 |
| SELMA HIGHWAY | 82 |
| ALLENVILLE ROAD | 79 |
| MCQUEEN VILLAGE ROAD | 78 |
| WASHINGTON FERRY ROAD | 71 |
| LEGENDS PARKWAY | 70 |
| OLD FARM LANE SOUTH | 67 |
| HIGHWAY 14 WEST | 66 |
| MARTIN LUTHER KING DRIVE | 65 |
| MCQUEEN SMITH ROAD NORTH | 64 |
| INTERSTATE 65 | 61 |
| COUNTY ROAD 85 | 60 |
2002 - 2018 National Fire Incident Reporting System (NFIRS) incidents
- Incident types reported to NFIRS in Prattville, AL
- 12,38564.2%Rescue & EMS
- 2,39512.4%Fire
- 1,2526.5%False Alarm
- 1,0935.7%Hazardous Condition
- 1,0725.6%Service Call
- 1,0095.2%Good Intent Call
- 380.2%Overpressure Rupture
- 230.1%Special Incident
- Fire incident types reported to NFIRS in Prattville, AL
- 1,10246.0%Outside Fires
- 68528.6%Structure Fires
- 52221.8%Mobile Property/Vehicle Fires
- 863.6%Other
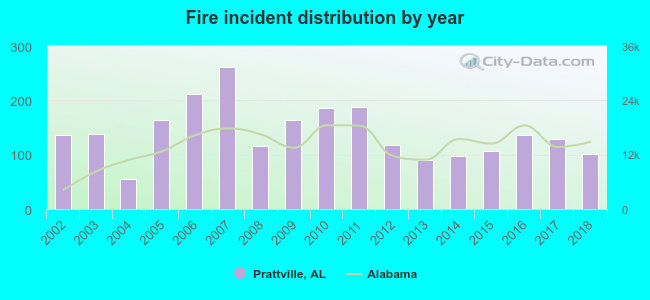 Based on the data from the years 2002 - 2018 the average number of fire incidents per year is 141. The highest number of reported fires - 261 took place in 2007, and the least - 55 in 2004. The data has a declining trend.
The average number of yearly fire incidents per 10k residents in Prattville, AL compared to nearest cities:
(Note: Based on data for the last 3 years, including only cities with population 5,000 and above)
| Prattville: | 34.6 |
| Millbrook: | 27.7 |
| Montgomery: | 46.5 |
| Marbury: | 10.1 |
| Wetumpka: | 110.1 |
| Hope Hull: | 3.4 |
| Titus: | 2.0 |
| Pike Road: | 57.1 |
| Clanton: | 160.4 |
 The median response time based on all reported fire incidents is 6 minutes. This is about the same as the Alabama median value.
The median response time in Prattville, AL compared to nearest cities:
(Note: Based on data for all years, including only cities with at least 500 fire incidents)
| Prattville: | 6 minutes |
| Millbrook: | 5 minutes |
| Montgomery: | 4 minutes |
| Wetumpka: | 7 minutes |
| Eclectic: | 9 minutes |
| Clanton: | 7 minutes |
| Tallassee: | 10 minutes |
| Selma: | 5 minutes |
| Jemison: | 10 minutes |
 Based on the reports from the years 2002 - 2018 the average number of fire-related fatalities per year is 1. The highest number of reported deaths - 4 took place in 2003, and the lowest - 0 in 2002. The data has a constant trend.
 Based on the data from the years 2002 - 2018 the average number of fire-related casualties per year is 1. The highest number of reported casualties - 3 took place in 2010, and the lowest - 0 in 2002. The data has a growing trend.
The average number of injuries per 1,000 fires is 7. This indicator was the highest - 22 in 2013, and the lowest 0 in 2002. The trend for casualties per 1,000 fire incidents is rising. Compared to the state value the number of injuries per 1,000 incidents is higher.
Based on the data from the years 2002 - 2018 the average number of fire-related casualties per year is 1. The highest number of reported casualties - 3 took place in 2010, and the lowest - 0 in 2002. The data has a growing trend.
The average number of injuries per 1,000 fires is 7. This indicator was the highest - 22 in 2013, and the lowest 0 in 2002. The trend for casualties per 1,000 fire incidents is rising. Compared to the state value the number of injuries per 1,000 incidents is higher.
 29.1% incidents where reported in the morning and 70.9% in the evening. The most fires (15.8%) took place on Saturday, and the least (13.5%) on Wednesday.
 Based on the 2,395 fire incident reports from years 2002 - 2018 most fires (9.2%) took place during June, and the least (7.4%) in September.
 Out of all 19,281 cases reported during the years 2002 - 2018, the most belonged to the categories: Rescue & EMS (64.2%), Fire (12.4%), and False Alarm (6.5%).
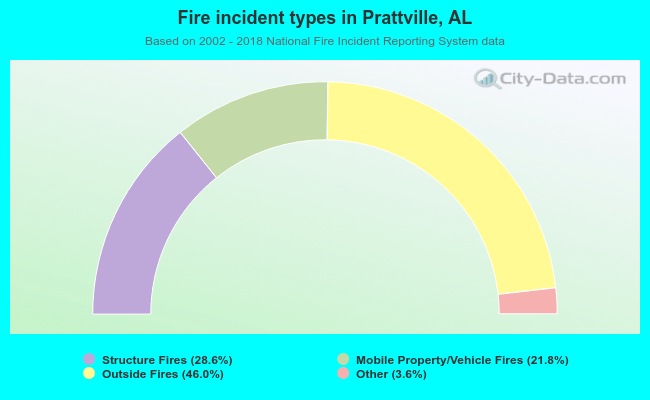 When looking into fire subcategories, the most reports belonged to: Outside Fires (46.0%), and Structure Fires (28.6%).