Millbrook: Fire Incidents, Alabama (AL)
Where are fire incidents reported in Millbrook, AL
Something went wrong! Please refresh the page.
|
| |||||||||||||||||||||||||||||||||||||||||||||||||||||||||||||||||||||||||||||||||||||||||||||||||||||||||||||
2003 - 2018 National Fire Incident Reporting System (NFIRS) incidents
- Incident types reported to NFIRS in Millbrook, AL
- 64037.3%Fire
- 31318.2%Rescue & EMS
- 28616.6%Hazardous Condition
- 19911.6%False Alarm
- 18710.9%Good Intent Call
- 834.8%Service Call
- 60.3%Severe Weather
- 30.2%Overpressure Rupture
- Fire incident types reported to NFIRS in Millbrook, AL
- 30647.8%Outside Fires
- 20431.9%Structure Fires
- 11417.8%Mobile Property/Vehicle Fires
- 162.5%Other
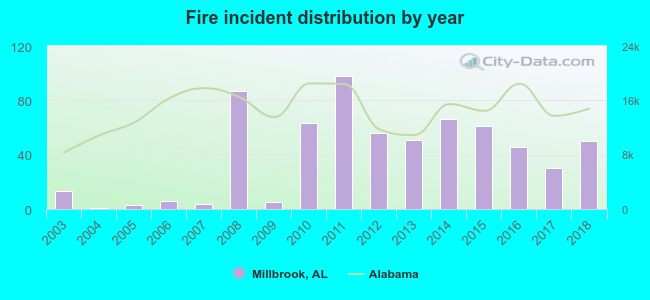 According to the data from the years 2003 - 2018 the average number of fire incidents per year is 40. The highest number of reported fires - 98 took place in 2011, and the least - 1 in 2004. The data has an increasing trend.
The average number of yearly fire incidents per 10k residents in Millbrook, AL compared to nearest cities:
(Note: Based on data for the last 3 years, including only cities with population 5,000 and above)
| Millbrook: | 27.7 |
| Prattville: | 34.6 |
| Wetumpka: | 110.1 |
| Montgomery: | 46.5 |
| Marbury: | 10.1 |
| Titus: | 2.0 |
| Hope Hull: | 3.4 |
| Pike Road: | 57.1 |
| Clanton: | 160.4 |
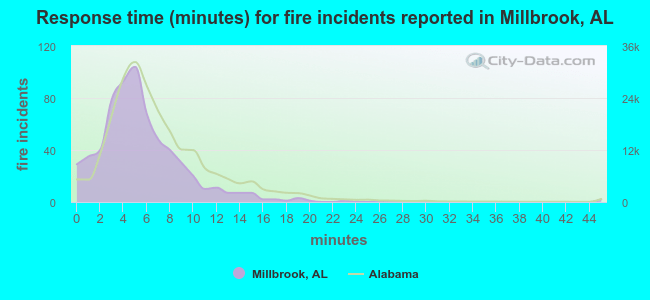 The median response time based on all reported fire incidents is 5 minutes. This is lower compared to the Alabama median value.
The median response time in Millbrook, AL compared to nearest cities:
(Note: Based on data for all years, including only cities with at least 500 fire incidents)
| Millbrook: | 5 minutes |
| Prattville: | 6 minutes |
| Wetumpka: | 7 minutes |
| Montgomery: | 4 minutes |
| Eclectic: | 9 minutes |
| Tallassee: | 10 minutes |
| Clanton: | 7 minutes |
| Jemison: | 10 minutes |
| Selma: | 5 minutes |
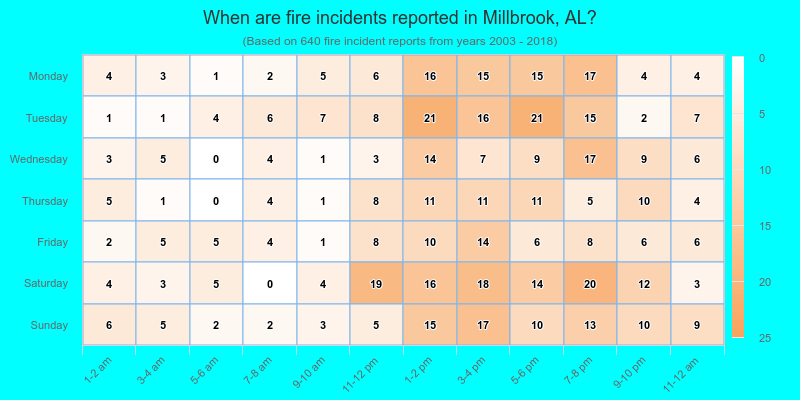
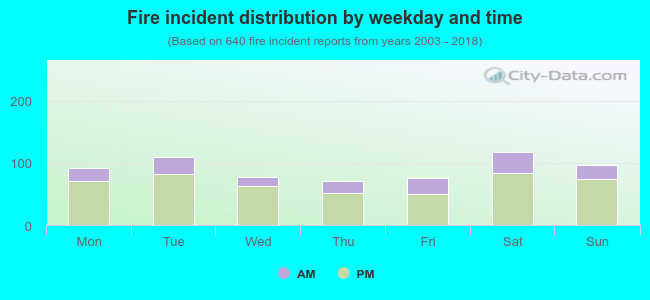 25.9% incidents where reported in the morning and 74.1% in the evening. The most fires (18.4%) took place on Saturday, and the least (11.1%) on Thursday.
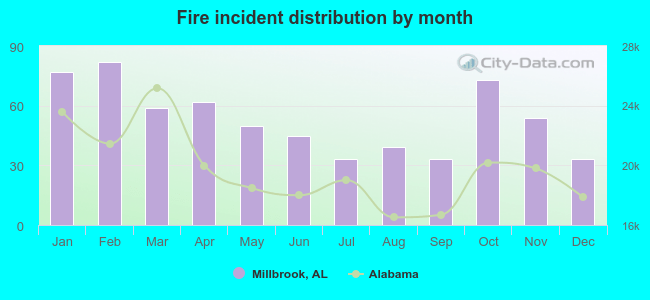 According to the 640 incident reports from years 2003 - 2018 most fires (12.8%) took place during February, and the least (5.2%) in July.
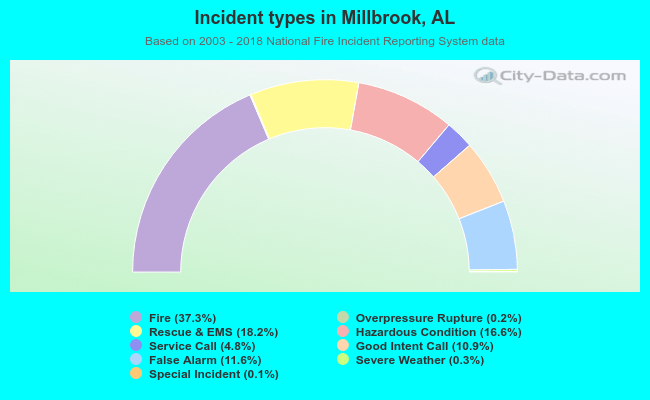 Out of all 1,718 cases reported during the years 2003 - 2018, the most belonged to the categories: Fire (37.3%), Rescue & EMS (18.2%), and Hazardous Condition (16.6%).
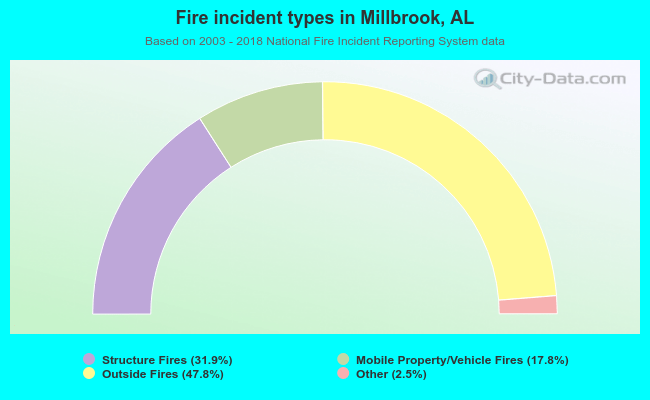 When looking into fire subcategories, the most reports belonged to: Outside Fires (47.8%), and Structure Fires (31.9%).