Moss Point: Fire Incidents, Mississippi (MS)
Where are fire incidents reported in Moss Point, MS
Something went wrong! Please refresh the page.
| Fire incidents reported | |
|---|---|
| Sreet name | Count |
| HWY 63 | 208 |
| HWY 613 | 164 |
| HIGHWAY 63 | 160 |
| INTERSTATE 10 HWY | 114 |
| HIGHWAY 613 | 106 |
| OLD STAGE RD | 106 |
| I-10 | 104 |
| ORANGE GROVE RD | 94 |
| GRIERSON ST | 92 |
| MAIN ST | 92 |
| HWY 90 HWY | 88 |
| BIG POINT | 82 |
| FORTS LAKE RD | 82 |
| 613 HWY | 76 |
| BAYOU CUMBEST RD | 68 |
| 63 HWY | 54 |
| HIGHWAY 63 HWY | 54 |
| GREGORY ST | 50 |
| HWY 63 HWY | 50 |
| KREOLE AVE | 50 |
| LILLY ORCHARD | 50 |
| INTERSTATE 10 | 48 |
| MAGNOLIA ST | 48 |
| SARACENNIA RD | 48 |
| I10 | 46 |
| ELDER ST | 44 |
| GRAND BATURE RD | 44 |
| ELDER FERRY RD | 40 |
| RED BLUFF | 40 |
| BAYOU HERON RD | 38 |
| Other | 3,577 |
2002 - 2018 National Fire Incident Reporting System (NFIRS) incidents
- Incident types reported to NFIRS in Moss Point, MS
- 5,91738.8%Fire
- 5,78637.9%Rescue & EMS
- 1,2127.9%Hazardous Condition
- 8215.4%False Alarm
- 7374.8%Service Call
- 7284.8%Good Intent Call
- 190.1%Severe Weather
- 190.1%Special Incident
- Fire incident types reported to NFIRS in Moss Point, MS
- 3,31156.0%Outside Fires
- 1,46524.8%Structure Fires
- 94816.0%Mobile Property/Vehicle Fires
- 1933.3%Other
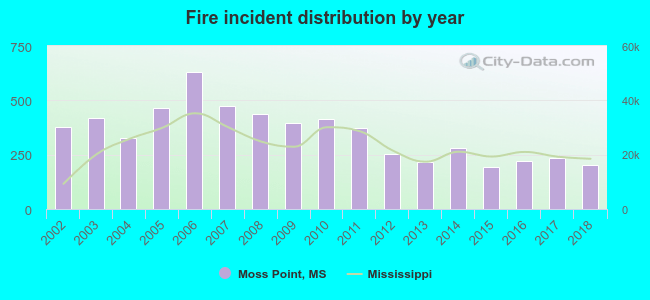 According to the data from the years 2002 - 2018 the average number of fire incidents per year is 348. The highest number of fire incidents - 632 took place in 2006, and the least - 193 in 2015. The data has a declining trend.
The average number of yearly fire incidents per 10k residents in Moss Point, MS compared to nearest cities:
(Note: Based on data for the last 3 years, including only cities with population 5,000 and above)
| Moss Point: | 160.4 |
| Pascagoula: | 45.6 |
| Gautier: | 53.1 |
| Vancleave: | 115.5 |
| Ocean Springs: | 102.1 |
| Biloxi: | 53.3 |
| Gulfport: | 58.2 |
| Long Beach: | 30.0 |
| Pass Christian: | 159.5 |
 The median response time based on all reported fire incidents is 5 minutes. This is lower than the state median value.
The median response time in Moss Point, MS compared to nearest cities:
(Note: Based on data for all years, including only cities with at least 500 fire incidents)
| Moss Point: | 5 minutes |
| Pascagoula: | 3 minutes |
| Gautier: | 4 minutes |
| Vancleave: | 9 minutes |
| Ocean Springs: | 4 minutes |
| Hurley: | 7 minutes |
| Theodore: | 7 minutes |
| Biloxi: | 4 minutes |
| Semmes: | 8 minutes |
 According to the reports from the years 2002 - 2018 the average number of fire-related fatalities per year is 1. The highest number of reported deaths - 2 took place in 2003, and the lowest - 0 in 2004. The data has a decreasing trend.
The average number of fatalities per 1,000 fires is 2. This indicator was the highest - 10 in 2015, and the lowest 0 in 2004. The trend for deaths per 1,000 incidents is declining. Compared to the Mississippi value the number of fatalities per 1,000 fire incidents is about the same.
According to the reports from the years 2002 - 2018 the average number of fire-related fatalities per year is 1. The highest number of reported deaths - 2 took place in 2003, and the lowest - 0 in 2004. The data has a decreasing trend.
The average number of fatalities per 1,000 fires is 2. This indicator was the highest - 10 in 2015, and the lowest 0 in 2004. The trend for deaths per 1,000 incidents is declining. Compared to the Mississippi value the number of fatalities per 1,000 fire incidents is about the same.Deaths per 1,000 incidents in Moss Point, MS compared to nearest cities:
(Note: Based on data for all years, including only cities with at least 2,500 fire incidents)
| Moss Point: | 2.2 |
| Pascagoula: | 2.6 |
| Ocean Springs: | 1.1 |
| Biloxi: | 1.5 |
| Mobile: | 0.9 |
| Gulfport: | 2.3 |
| Lucedale: | 1.9 |
| Saucier: | 2.0 |
 According to the data from the years 2002 - 2018 the average number of fire-related casualties per year is 1. The highest number of casualties - 5 took place in 2002, and the lowest - 0 in 2005. The data has a decreasing trend.
The average number of injuries per 1,000 fires is 4. This indicator was the highest - 16 in 2015, and the lowest 0 in 2005. The trend for injuries per 1,000 incidents is dropping. Compared to the state value the number of casualties per 1,000 incidents is similar.
According to the data from the years 2002 - 2018 the average number of fire-related casualties per year is 1. The highest number of casualties - 5 took place in 2002, and the lowest - 0 in 2005. The data has a decreasing trend.
The average number of injuries per 1,000 fires is 4. This indicator was the highest - 16 in 2015, and the lowest 0 in 2005. The trend for injuries per 1,000 incidents is dropping. Compared to the state value the number of casualties per 1,000 incidents is similar.Casualties per 1,000 incidents in Moss Point, MS compared to nearest cities:
(Note: Based on data for all years, including only cities with at least 500 fire incidents)
| Moss Point: | 3.4 |
| Pascagoula: | 0.7 |
| Gautier: | 17.6 |
| Vancleave: | 6.0 |
| Ocean Springs: | 7.8 |
| Hurley: | 7.3 |
| Theodore: | 0.0 |
| Biloxi: | 15.1 |
| Semmes: | 0.0 |
 30.0% incidents where reported in the morning and 70.0% in the evening. The most fires (16.5%) took place on Saturday, and the least (13.1%) on Tuesday.
 Based on the 5,917 reports from years 2002 - 2018 most fires (12.5%) took place during March, and the least (5.2%) in August.
 Out of all 15,247 cases reported during the years 2002 - 2018, the most belonged to the categories: Fire (38.8%), Rescue & EMS (37.9%), and Hazardous Condition (7.9%).
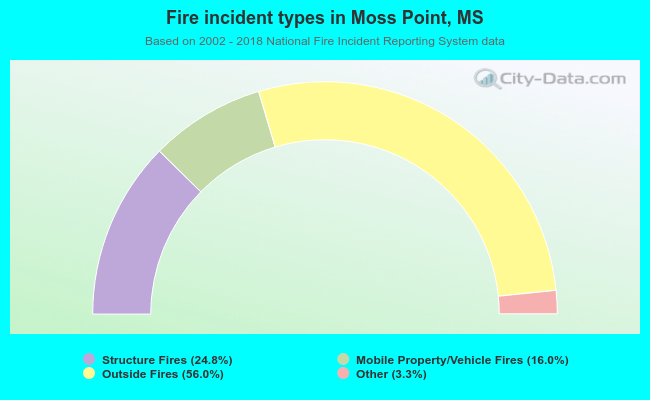 When looking into fire subcategories, the most incidents belonged to: Outside Fires (56.0%), and Structure Fires (24.8%).