Biloxi: Fire Incidents, Mississippi (MS)
Where are fire incidents reported in Biloxi, MS
Something went wrong! Please refresh the page.
| Fire incidents reported | |
|---|---|
| Sreet name | Count |
| BEACH BLVD | 956 |
| PASS RD | 356 |
| POPPS FERRY RD | 258 |
| CEDAR LAKE RD | 174 |
| BAYVIEW AVE | 160 |
| STENNIS DR | 140 |
| EISENHOWER DR | 132 |
| OLD HIGHWAY 67 | 116 |
| DIVISION ST | 106 |
| OAKLAWN RD | 104 |
| IRISH HILL DR | 102 |
| MCDONNELL AVE | 102 |
| HUDSON KROHN RD | 94 |
| LORRAINE RD | 94 |
| BEAUVOIR RD | 92 |
| INTERSTATE 10 | 92 |
| WOOLMARKET RD | 90 |
| LAMEUSE ST | 86 |
| DEBUYS RD | 84 |
| HOWARD AVE | 78 |
| JUDGE SEKUL AVE | 78 |
| MOTSIE RD | 76 |
| VETERANS AVE | 76 |
| PORTER AVE | 72 |
| BENACHI AVE | 70 |
| BIG RIDGE | 62 |
| LEE ST | 62 |
| REYNOIR ST | 60 |
| BRASHER RD | 58 |
| JOHN LEE RD | 58 |
| Other | 1,083 |
2002 - 2018 National Fire Incident Reporting System (NFIRS) incidents
- Incident types reported to NFIRS in Biloxi, MS
- 21,30254.2%Rescue & EMS
- 5,17113.2%Fire
- 3,7589.6%Good Intent Call
- 3,5249.0%Hazardous Condition
- 3,3528.5%False Alarm
- 2,0525.2%Service Call
- 570.1%Overpressure Rupture
- Fire incident types reported to NFIRS in Biloxi, MS
- 2,57349.8%Outside Fires
- 1,45728.2%Structure Fires
- 89017.2%Mobile Property/Vehicle Fires
- 2514.9%Other
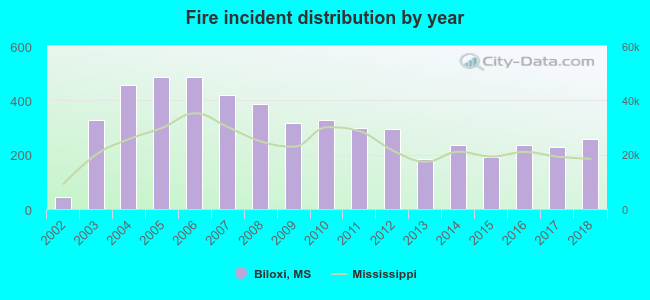 According to the data from the years 2002 - 2018 the average number of fires per year is 304. The highest number of reported fire incidents - 487 took place in 2006, and the least - 45 in 2002. The data has an increasing trend.
The average number of yearly fire incidents per 10k residents in Biloxi, MS compared to nearest cities:
(Note: Based on data for the last 3 years, including only cities with population 5,000 and above)
| Biloxi: | 53.3 |
| Ocean Springs: | 102.1 |
| Gulfport: | 58.2 |
| Long Beach: | 30.0 |
| Gautier: | 53.1 |
| Vancleave: | 115.5 |
| Pass Christian: | 159.5 |
| Pascagoula: | 45.6 |
| Moss Point: | 160.4 |
 The median response time based on all reported fire incidents is 4 minutes. This is lower compared to the Mississippi median value.
The median response time in Biloxi, MS compared to nearest cities:
(Note: Based on data for all years, including only cities with at least 500 fire incidents)
| Biloxi: | 4 minutes |
| Ocean Springs: | 4 minutes |
| Gulfport: | 5 minutes |
| Long Beach: | 5 minutes |
| Gautier: | 4 minutes |
| Vancleave: | 9 minutes |
| Saucier: | 8 minutes |
| Pass Christian: | 6 minutes |
| Pascagoula: | 3 minutes |
 According to the reports from the years 2002 - 2018 the average number of fire-related yearly deaths is 0. The highest number of reported deaths - 3 took place in 2003, and the lowest - 0 in 2002. The data has an increasing trend.
The average number of deaths per 1,000 fire incidents is 2. This indicator was the highest - 9 in 2003, and the lowest 0 in 2002. The trend for fatalities per 1,000 incidents is increasing. Compared to the state value the number of fatalities per 1,000 incidents is lower.
According to the reports from the years 2002 - 2018 the average number of fire-related yearly deaths is 0. The highest number of reported deaths - 3 took place in 2003, and the lowest - 0 in 2002. The data has an increasing trend.
The average number of deaths per 1,000 fire incidents is 2. This indicator was the highest - 9 in 2003, and the lowest 0 in 2002. The trend for fatalities per 1,000 incidents is increasing. Compared to the state value the number of fatalities per 1,000 incidents is lower.Deaths per 1,000 incidents in Biloxi, MS compared to nearest cities:
(Note: Based on data for all years, including only cities with at least 2,500 fire incidents)
| Biloxi: | 1.5 |
| Ocean Springs: | 1.1 |
| Gulfport: | 2.3 |
| Saucier: | 2.0 |
| Pascagoula: | 2.6 |
| Moss Point: | 2.2 |
| Lucedale: | 1.9 |
| Picayune: | 2.7 |
| Lumberton: | 1.6 |
 Based on the data from the years 2002 - 2018 the average number of fire-related yearly casualties is 5. The highest number of reported casualties - 16 took place in 2014, and the lowest - 0 in 2002. The data has a growing trend.
The average number of injuries per 1,000 fires is 16. This indicator was the highest - 68 in 2014, and the lowest 0 in 2002. The trend for injuries per 1,000 incidents is growing. Compared to the state value the number of casualties per 1,000 fires is much higher.
Based on the data from the years 2002 - 2018 the average number of fire-related yearly casualties is 5. The highest number of reported casualties - 16 took place in 2014, and the lowest - 0 in 2002. The data has a growing trend.
The average number of injuries per 1,000 fires is 16. This indicator was the highest - 68 in 2014, and the lowest 0 in 2002. The trend for injuries per 1,000 incidents is growing. Compared to the state value the number of casualties per 1,000 fires is much higher.Casualties per 1,000 incidents in Biloxi, MS compared to nearest cities:
(Note: Based on data for all years, including only cities with at least 500 fire incidents)
| Biloxi: | 15.1 |
| Ocean Springs: | 7.8 |
| Gulfport: | 11.7 |
| Long Beach: | 3.8 |
| Gautier: | 17.6 |
| Vancleave: | 6.0 |
| Saucier: | 6.3 |
| Pass Christian: | 3.0 |
| Pascagoula: | 0.7 |
 30.4% incidents where reported in the morning and 69.6% in the evening. The most fires (15.1%) took place on Saturday, and the least (13.6%) on Friday.
 Based on the 5,171 incident reports from years 2002 - 2018 most fires (10.1%) took place during April, and the least (6.6%) in August.
 Out of all 39,280 cases reported during the years 2002 - 2018, the most belonged to the categories: Rescue & EMS (54.2%), Fire (13.2%), and Good Intent Call (9.6%).
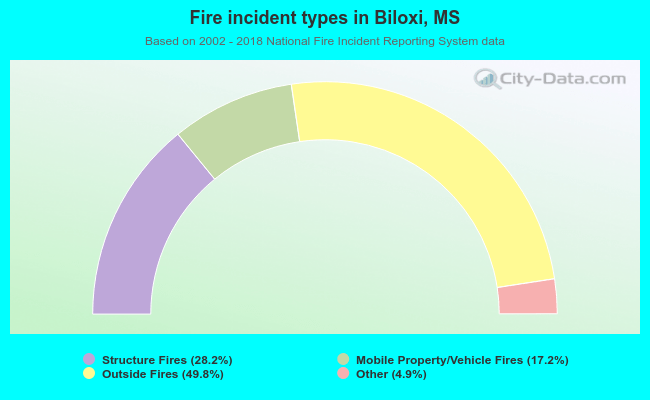 When looking into fire subcategories, the most reports belonged to: Outside Fires (49.8%), and Structure Fires (28.2%).