Gautier: Fire Incidents, Mississippi (MS)
Where are fire incidents reported in Gautier, MS
Something went wrong! Please refresh the page.
| Fire incidents reported | |
|---|---|
| Sreet name | Count |
| HIGHWAY 90 | 196 |
| LADNIER RD | 176 |
| INTERSTATE 10 | 138 |
| MARTIN BLUFF RD | 138 |
| OLD SPANISH TRL | 112 |
| GAUTIER-VANCLEAVE RD | 76 |
| I-10 | 72 |
| HASTINGS RD | 58 |
| GRAVELINE RD | 54 |
| I10 | 50 |
| 90 HWY | 44 |
| GAUTIERVANCLEAVE RD | 42 |
| BONITA RD | 40 |
| VICTORIA DR | 40 |
| KINGFISHER DR | 38 |
| LAURELGLEN RD | 38 |
| OLD SPANISH TRAIL | 36 |
| INDIAN POINT PKY | 34 |
| WESTGATE PKY | 32 |
| BROWN RD | 30 |
| HIGHWAY 57 | 30 |
| RIVERSIDE DR | 30 |
| DOLPHIN DR | 28 |
| TIMBERLANE RD | 28 |
| CAMINO GRANDE | 26 |
| OLD SHELL LANDING RD | 26 |
| PRINCE GEORGE DR | 26 |
| RIDGEWAY DR | 26 |
| DAILEY RD | 24 |
| DE LA POINTE DR | 22 |
| Other | 52 |
2003 - 2018 National Fire Incident Reporting System (NFIRS) incidents
- Incident types reported to NFIRS in Gautier, MS
- 5,39956.2%Rescue & EMS
- 1,76218.4%Fire
- 8699.1%Good Intent Call
- 7457.8%Service Call
- 4915.1%Hazardous Condition
- 3173.3%False Alarm
- Fire incident types reported to NFIRS in Gautier, MS
- 88850.4%Outside Fires
- 43224.5%Structure Fires
- 34919.8%Mobile Property/Vehicle Fires
- 935.3%Other
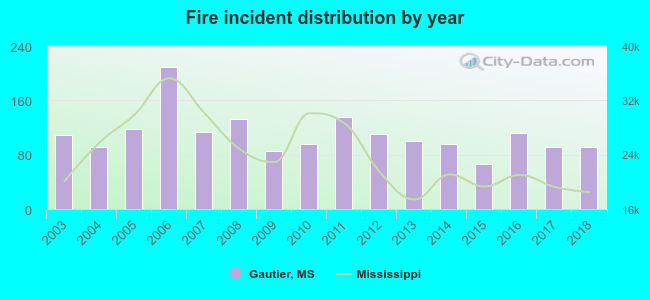 Based on the data from the years 2003 - 2018 the average number of fire incidents per year is 110. The highest number of fires - 209 took place in 2006, and the least - 66 in 2015. The data has a declining trend.
The average number of yearly fire incidents per 10k residents in Gautier, MS compared to nearest cities:
(Note: Based on data for the last 3 years, including only cities with population 5,000 and above)
| Gautier: | 53.1 |
| Pascagoula: | 45.6 |
| Moss Point: | 160.4 |
| Ocean Springs: | 102.1 |
| Vancleave: | 115.5 |
| Biloxi: | 53.3 |
| Gulfport: | 58.2 |
| Long Beach: | 30.0 |
| Pass Christian: | 159.5 |
 The median response time based on all reported fire incidents is 4 minutes. This is lower compared to the state median value.
The median response time in Gautier, MS compared to nearest cities:
(Note: Based on data for all years, including only cities with at least 500 fire incidents)
| Gautier: | 4 minutes |
| Pascagoula: | 3 minutes |
| Moss Point: | 5 minutes |
| Ocean Springs: | 4 minutes |
| Vancleave: | 9 minutes |
| Biloxi: | 4 minutes |
| Hurley: | 7 minutes |
| Gulfport: | 5 minutes |
| Theodore: | 7 minutes |
 Based on the reports from the years 2003 - 2018 the average number of fire-related fatalities per year is 0. The highest number of reported deaths - 2 took place in 2012, and the lowest - 0 in 2003. The data has a constant trend.
 Based on the data from the years 2003 - 2018 the average number of fire-related casualties per year is 2. The highest number of reported casualties - 6 took place in 2013, and the lowest - 0 in 2010. The data has a declining trend.
The average number of injuries per 1,000 fire incidents is 18. This indicator was the highest - 60 in 2013, and the lowest 0 in 2010. The trend for casualties per 1,000 fire incidents is dropping. Compared to the state value the number of injuries per 1,000 fires is much higher.
Based on the data from the years 2003 - 2018 the average number of fire-related casualties per year is 2. The highest number of reported casualties - 6 took place in 2013, and the lowest - 0 in 2010. The data has a declining trend.
The average number of injuries per 1,000 fire incidents is 18. This indicator was the highest - 60 in 2013, and the lowest 0 in 2010. The trend for casualties per 1,000 fire incidents is dropping. Compared to the state value the number of injuries per 1,000 fires is much higher.Casualties per 1,000 incidents in Gautier, MS compared to nearest cities:
(Note: Based on data for all years, including only cities with at least 500 fire incidents)
| Gautier: | 17.6 |
| Pascagoula: | 0.7 |
| Moss Point: | 3.4 |
| Ocean Springs: | 7.8 |
| Vancleave: | 6.0 |
| Biloxi: | 15.1 |
| Hurley: | 7.3 |
| Gulfport: | 11.7 |
| Theodore: | 0.0 |
 28.6% incidents where reported in the morning and 71.4% in the evening. The most fires (15.9%) took place on Saturday, and the least (12.9%) on Tuesday.
 According to the 1,762 fire incidents from years 2003 - 2018 most fires (10.1%) took place during May, and the least (6.1%) in August.
 Out of all 9,602 cases reported during the years 2003 - 2018, the most belonged to the categories: Rescue & EMS (56.2%), Fire (18.4%), and Good Intent Call (9.1%).
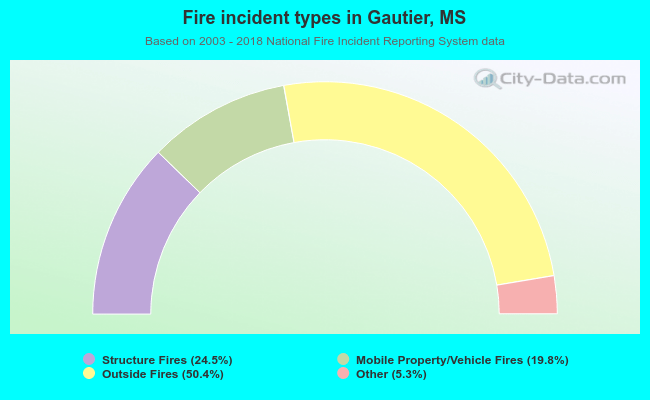 When looking into fire subcategories, the most incidents belonged to: Outside Fires (50.4%), and Structure Fires (24.5%).