Semmes: Fire Incidents, Alabama (AL)
Where are fire incidents reported in Semmes, AL
Something went wrong! Please refresh the page.
|
| |||||||||||||||||||||||||||||||||||||||||||||||||||||||||||||||||||||||||||||||||||||||||||||||||||||||||||||
2006 - 2018 National Fire Incident Reporting System (NFIRS) incidents
- Incident types reported to NFIRS in Semmes, AL
- 5,30872.1%Rescue & EMS
- 6669.1%Good Intent Call
- 5928.0%Fire
- 3815.2%Service Call
- 2623.6%False Alarm
- 1281.7%Hazardous Condition
- 90.1%Special Incident
- 80.1%Overpressure Rupture
- Fire incident types reported to NFIRS in Semmes, AL
- 29950.5%Outside Fires
- 20534.6%Structure Fires
- 589.8%Mobile Property/Vehicle Fires
- 305.1%Other
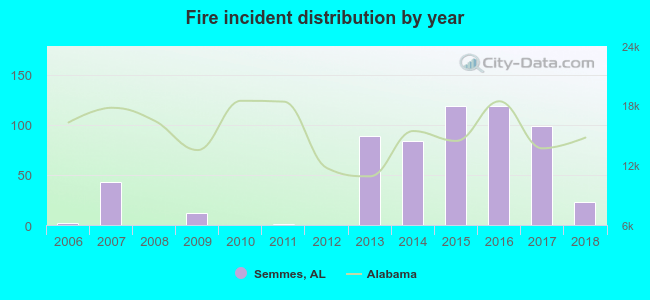 According to the data from the years 2006 - 2018 the average number of fires per year is 45. The highest number of fires - 119 took place in 2015, and the least - 0 in 2008. The data has a growing trend.
The average number of yearly fire incidents per 10k residents in Semmes, AL compared to nearest cities:
(Note: Based on data for the last 3 years, including only cities with population 5,000 and above)
| Semmes: | 45.4 |
| Prichard: | 37.1 |
| Saraland: | 41.2 |
| Chickasaw: | 1.7 |
| Mobile: | 15.4 |
| Satsuma: | 58.4 |
| Theodore: | 115.3 |
| Spanish Fort: | 34.2 |
| Daphne: | 35.3 |
 The median response time based on all reported fire incidents is 8 minutes. This is higher than the Alabama median value.
The median response time in Semmes, AL compared to nearest cities:
(Note: Based on data for all years, including only cities with at least 500 fire incidents)
| Semmes: | 8 minutes |
| Prichard: | 5 minutes |
| Saraland: | 5 minutes |
| Mobile: | 7 minutes |
| Satsuma: | 4 minutes |
| Theodore: | 7 minutes |
| Daphne: | 6 minutes |
| Fairhope: | 8 minutes |
| Bay Minette: | 5 minutes |
 23.3% incidents where reported in the morning and 76.7% in the evening. The most fires (15.9%) took place on Saturday, and the least (11.3%) on Wednesday.
 According to the 592 fire incident reports from years 2006 - 2018 most fires (13.0%) took place during January, and the least (3.0%) in September.
 Out of all 7,359 cases reported during the years 2006 - 2018, the most belonged to the categories: Rescue & EMS (72.1%), Good Intent Call (9.1%), and Fire (8.0%).
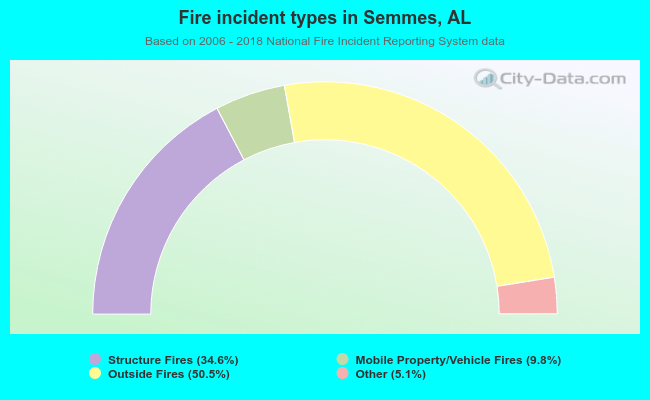 When looking into fire subcategories, the most reports belonged to: Outside Fires (50.5%), and Structure Fires (34.6%).