Manteno: Fire Incidents, Illinois (IL)
Where are fire incidents reported in Manteno, IL
Something went wrong! Please refresh the page.
| Fire incidents reported | |
|---|---|
| Sreet name | Count |
| MANTENO STA | 248 |
| LOCUST ST | 50 |
| LOCUST | 48 |
| MAIN ST | 42 |
| DIVISION ST | 40 |
| 10000N RD | 38 |
| OAK ST | 28 |
| WALNUT | 28 |
| 7000N RD | 26 |
| 9000N RD | 26 |
| 11000N RD | 24 |
| WALNUT ST | 24 |
| 5000E RD | 22 |
| CYPRESS ST | 22 |
| 1000E RD | 20 |
| ADAMS | 18 |
| SYCAMORE RD | 18 |
| 12000N RD | 16 |
| 7000 N RD | 16 |
| 9000 N. RD | 16 |
| SYCAMORE ST | 16 |
| WATSON AVE | 16 |
| 4000E RD | 14 |
| 50 | 14 |
| 9000 N RD | 14 |
| BLUEGILL RD | 14 |
| I-57 | 14 |
| I57 | 14 |
| KAY DR | 14 |
| MAPLE ST | 14 |
| Other | 420 |
2003 - 2018 National Fire Incident Reporting System (NFIRS) incidents
- Incident types reported to NFIRS in Manteno, IL
- 7,11059.2%Rescue & EMS
- 1,51112.6%Service Call
- 1,33411.1%Fire
- 7396.2%Hazardous Condition
- 7035.9%Good Intent Call
- 5975.0%False Alarm
- Fire incident types reported to NFIRS in Manteno, IL
- 74155.5%Structure Fires
- 42631.9%Outside Fires
- 1168.7%Mobile Property/Vehicle Fires
- 513.8%Other
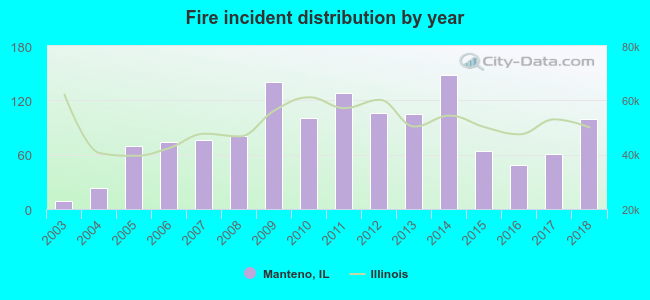 Based on the data from the years 2003 - 2018 the average number of fires per year is 83. The highest number of fires - 148 took place in 2014, and the least - 9 in 2003. The data has a rising trend.
The average number of yearly fire incidents per 10k residents in Manteno, IL compared to nearest cities:
(Note: Based on data for the last 3 years, including only cities with population 5,000 and above)
| Manteno: | 77.2 |
| Bourbonnais: | 49.1 |
| Bradley: | 35.3 |
| Kankakee: | 93.8 |
| Monee: | 131.9 |
| Manhattan: | 60.7 |
| University Park: | 72.8 |
| Wilmington: | 146.5 |
| Richton Park: | 46.3 |
 The median response time based on all reported fire incidents is 8 minutes. This is higher than the state median value.
The median response time in Manteno, IL compared to nearest cities:
(Note: Based on data for all years, including only cities with at least 500 fire incidents)
| Manteno: | 8 minutes |
| Peotone: | 8 minutes |
| Bourbonnais: | 6 minutes |
| Bradley: | 6 minutes |
| Kankakee: | 4 minutes |
| Grant Park: | 8 minutes |
| Momence: | 10 minutes |
| Monee: | 6 minutes |
| Beecher: | 8 minutes |
 28.7% incidents where reported in the morning and 71.3% in the evening. The most fires (17.4%) took place on Monday, and the least (11.2%) on Wednesday.
 Based on the 1,334 incident reports from years 2003 - 2018 most fires (13.6%) took place during January, and the least (4.1%) in February.
 Out of all 12,008 cases reported during the years 2003 - 2018, the most belonged to the categories: Rescue & EMS (59.2%), Service Call (12.6%), and Fire (11.1%).
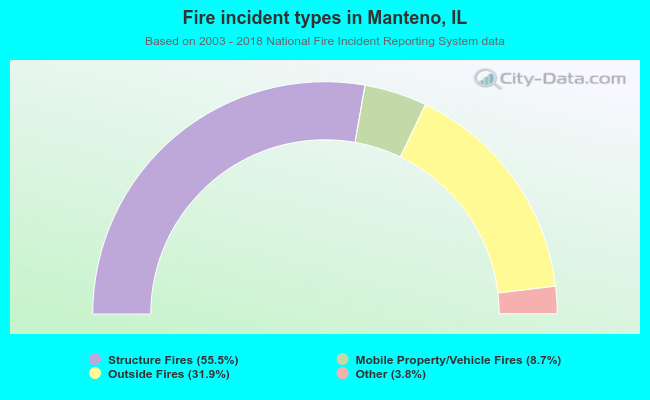 When looking into fire subcategories, the most incidents belonged to: Structure Fires (55.5%), and Outside Fires (31.9%).