Kankakee: Fire Incidents, Illinois (IL)
Where are fire incidents reported in Kankakee, IL
Something went wrong! Please refresh the page.
| Fire incidents reported | |
|---|---|
| Sreet name | Count |
| COURT ST | 384 |
| SCHUYLER AVE | 232 |
| 5TH AVE | 200 |
| DEARBORN AVE | 192 |
| WASHINGTON AVE | 186 |
| CHICAGO AVE | 148 |
| GREENWOOD AVE | 144 |
| HARRISON AVE | 132 |
| STATION ST | 122 |
| RIVER ST | 120 |
| EAST AVE | 114 |
| EVERGREEN AVE | 112 |
| 3RD AVE | 108 |
| ROUTE 17 HWY | 108 |
| 4TH AVE | 106 |
| WILDWOOD AVE | 94 |
| 57 | 92 |
| HOBBIE AVE | 92 |
| MERCHANT ST | 92 |
| ROSEWOOD AVE | 92 |
| INDIANA AVE | 88 |
| OAK ST | 86 |
| JEFFERY ST | 84 |
| WALL ST | 78 |
| 5000 RD | 76 |
| ELM AVE | 76 |
| 2000 RD | 72 |
| GRINNELL RD | 70 |
| MAPLE ST | 70 |
| NELSON AVE | 66 |
| Other | 1,301 |
2002 - 2018 National Fire Incident Reporting System (NFIRS) incidents
- Incident types reported to NFIRS in Kankakee, IL
- 23,01860.1%Rescue & EMS
- 4,93712.9%Fire
- 4,02910.5%Hazardous Condition
- 2,5346.6%False Alarm
- 1,9915.2%Good Intent Call
- 1,6864.4%Service Call
- 570.1%Overpressure Rupture
- Fire incident types reported to NFIRS in Kankakee, IL
- 2,44149.4%Structure Fires
- 1,64933.4%Outside Fires
- 70914.4%Mobile Property/Vehicle Fires
- 1382.8%Other
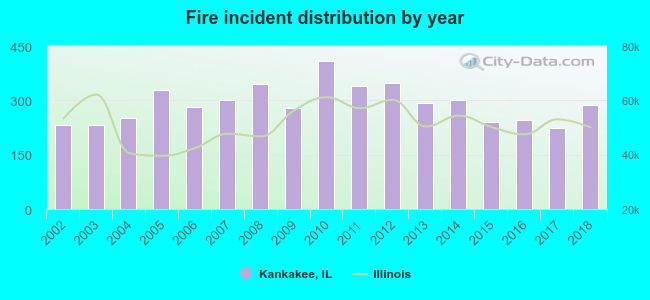 According to the data from the years 2002 - 2018 the average number of fire incidents per year is 290. The highest number of reported fires - 408 took place in 2010, and the least - 223 in 2017. The data has an increasing trend.
The average number of yearly fire incidents per 10k residents in Kankakee, IL compared to nearest cities:
(Note: Based on data for the last 3 years, including only cities with population 5,000 and above)
| Kankakee: | 93.8 |
| Bradley: | 35.3 |
| Bourbonnais: | 49.1 |
| Manteno: | 77.2 |
| Wilmington: | 146.5 |
| Braidwood: | 46.3 |
| Monee: | 131.9 |
| Manhattan: | 60.7 |
| University Park: | 72.8 |
 The median response time based on all reported fire incidents is 4 minutes. This is lower than the state median value.
The median response time in Kankakee, IL compared to nearest cities:
(Note: Based on data for all years, including only cities with at least 500 fire incidents)
| Kankakee: | 4 minutes |
| Bradley: | 6 minutes |
| Bourbonnais: | 6 minutes |
| Manteno: | 8 minutes |
| St. Anne: | 11 minutes |
| Momence: | 10 minutes |
| Hopkins Park: | 17 minutes |
| Grant Park: | 8 minutes |
| Peotone: | 8 minutes |
 According to the reports from the years 2002 - 2018 the average number of fire-related yearly deaths is 1. The highest number of deaths - 3 took place in 2016, and the lowest - 0 in 2004. The data has an increasing trend.
The average number of deaths per 1,000 fires is 2. This indicator was the highest - 12 in 2016, and the lowest 0 in 2004. The trend for fatalities per 1,000 incidents is growing. Compared to the Illinois value the number of deaths per 1,000 fire incidents is about the same.
According to the reports from the years 2002 - 2018 the average number of fire-related yearly deaths is 1. The highest number of deaths - 3 took place in 2016, and the lowest - 0 in 2004. The data has an increasing trend.
The average number of deaths per 1,000 fires is 2. This indicator was the highest - 12 in 2016, and the lowest 0 in 2004. The trend for fatalities per 1,000 incidents is growing. Compared to the Illinois value the number of deaths per 1,000 fire incidents is about the same.Deaths per 1,000 incidents in Kankakee, IL compared to nearest cities:
(Note: Based on data for all years, including only cities with at least 2,500 fire incidents)
| Kankakee: | 2.2 |
 Based on the reports from the years 2002 - 2018 the average number of fire-related yearly casualties is 7. The highest number of reported casualties - 20 took place in 2008, and the lowest - 1 in 2014. The data has a constant trend.
The average number of casualties per 1,000 fires is 23. This indicator was the highest - 58 in 2008, and the lowest 3 in 2014. The trend for casualties per 1,000 fire incidents is declining. Compared to the Illinois value the number of casualties per 1,000 fire incidents is much higher.
Based on the reports from the years 2002 - 2018 the average number of fire-related yearly casualties is 7. The highest number of reported casualties - 20 took place in 2008, and the lowest - 1 in 2014. The data has a constant trend.
The average number of casualties per 1,000 fires is 23. This indicator was the highest - 58 in 2008, and the lowest 3 in 2014. The trend for casualties per 1,000 fire incidents is declining. Compared to the Illinois value the number of casualties per 1,000 fire incidents is much higher.Casualties per 1,000 incidents in Kankakee, IL compared to nearest cities:
(Note: Based on data for all years, including only cities with at least 500 fire incidents)
| Kankakee: | 22.5 |
| Bradley: | 0.9 |
| Bourbonnais: | 9.5 |
| Manteno: | 3.0 |
| St. Anne: | 0.0 |
| Momence: | 0.0 |
| Hopkins Park: | 0.0 |
| Grant Park: | 4.5 |
| Peotone: | 12.6 |
 32.5% incidents where reported in the morning and 67.5% in the evening. The most fires (15.7%) took place on Saturday, and the least (13.2%) on Monday.
 According to the 4,937 reports from years 2002 - 2018 most fires (10.6%) took place during July, and the least (5.7%) in December.
 Out of all 38,306 cases reported during the years 2002 - 2018, the most belonged to the categories: Rescue & EMS (60.1%), Fire (12.9%), and Hazardous Condition (10.5%).
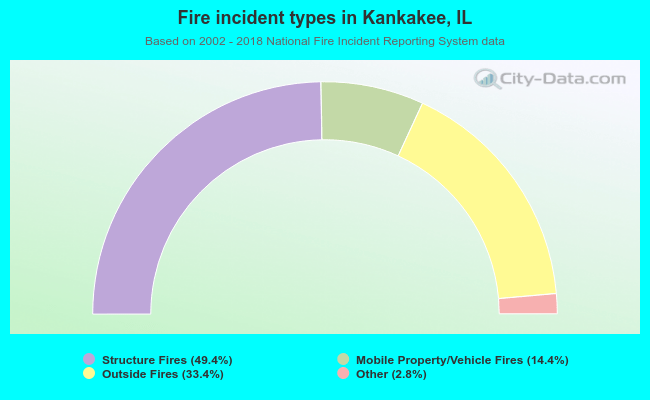 When looking into fire subcategories, the most reports belonged to: Structure Fires (49.4%), and Outside Fires (33.4%).