Bradley: Fire Incidents, Illinois (IL)
Where are fire incidents reported in Bradley, IL
Something went wrong! Please refresh the page.
| Fire incidents reported | |
|---|---|
| Sreet name | Count |
| KINZIE | 150 |
| KENNEDY DR | 94 |
| STATE RT 50 | 70 |
| BROADWAY | 58 |
| NORTH ST | 58 |
| UNCLE LEO DR | 52 |
| WASHINGTON | 46 |
| SCHUYLER | 42 |
| EUCLID | 38 |
| WABASH | 36 |
| JEFFERSON | 34 |
| FOREST | 32 |
| MICHIGAN | 32 |
| MADISON | 28 |
| BROADWAY ST | 26 |
| KINZIE AVE | 24 |
| RT 50 | 24 |
| ST RT 50 | 24 |
| MICHIGAN AVE | 20 |
| CLINTON | 18 |
| DOUGLAS AVE | 18 |
| FULTON | 18 |
| RANDOLPH | 18 |
| DOUBLE JACK | 16 |
| LOCKE DR | 16 |
| BLAINE | 14 |
| DEARBORN | 14 |
| ARMOUR | 12 |
| BRADLEY FIRE | 12 |
| DOUBLEJACK | 12 |
| Other | 69 |
2002 - 2018 National Fire Incident Reporting System (NFIRS) incidents
- Incident types reported to NFIRS in Bradley, IL
- 7,24859.5%Rescue & EMS
- 1,1419.4%False Alarm
- 1,1259.2%Fire
- 1,0969.0%Hazardous Condition
- 1,0628.7%Service Call
- 4864.0%Good Intent Call
- Fire incident types reported to NFIRS in Bradley, IL
- 64757.5%Structure Fires
- 25522.7%Outside Fires
- 13712.2%Mobile Property/Vehicle Fires
- 867.6%Other
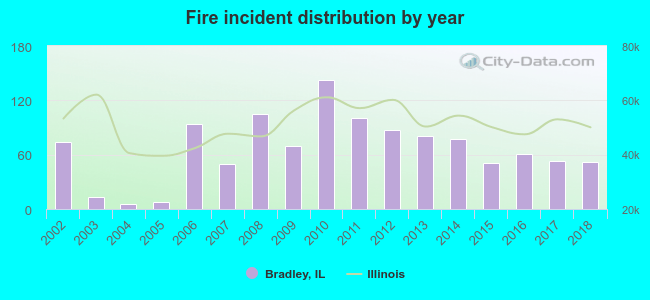 According to the data from the years 2002 - 2018 the average number of fire incidents per year is 66. The highest number of fire incidents - 143 took place in 2010, and the least - 6 in 2004. The data has a decreasing trend.
The average number of yearly fire incidents per 10k residents in Bradley, IL compared to nearest cities:
(Note: Based on data for the last 3 years, including only cities with population 5,000 and above)
| Bradley: | 35.3 |
| Bourbonnais: | 49.1 |
| Kankakee: | 93.8 |
| Manteno: | 77.2 |
| Wilmington: | 146.5 |
| Monee: | 131.9 |
| Manhattan: | 60.7 |
| Braidwood: | 46.3 |
| University Park: | 72.8 |
 The median response time based on all reported fire incidents is 6 minutes. This is similar to the Illinois median value.
The median response time in Bradley, IL compared to nearest cities:
(Note: Based on data for all years, including only cities with at least 500 fire incidents)
| Bradley: | 6 minutes |
| Bourbonnais: | 6 minutes |
| Kankakee: | 4 minutes |
| Manteno: | 8 minutes |
| Momence: | 10 minutes |
| St. Anne: | 11 minutes |
| Grant Park: | 8 minutes |
| Peotone: | 8 minutes |
| Hopkins Park: | 17 minutes |
 31.1% incidents where reported in the morning and 68.9% in the evening. The most fires (16.1%) took place on Wednesday, and the least (12.2%) on Monday.
 According to the 1,125 fires from years 2002 - 2018 most fires (10.9%) took place during January, and the least (6.6%) in June.
 Out of all 12,181 cases reported during the years 2002 - 2018, the most belonged to the categories: Rescue & EMS (59.5%), False Alarm (9.4%), and Fire (9.2%).
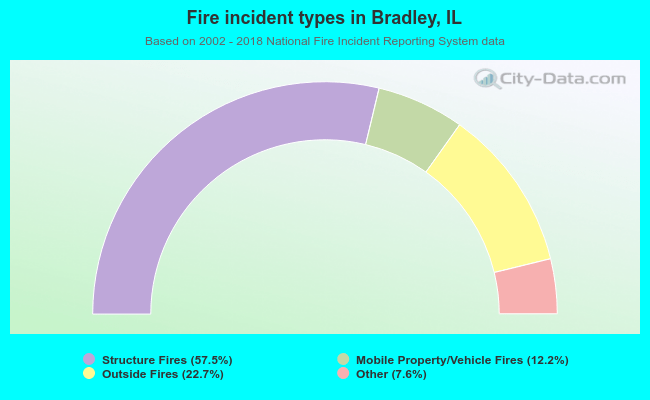 When looking into fire subcategories, the most reports belonged to: Structure Fires (57.5%), and Outside Fires (22.7%).