University Park: Fire Incidents, Illinois (IL)
Where are fire incidents reported in University Park, IL
Something went wrong! Please refresh the page.
| Fire incidents reported | |
|---|---|
| Sreet name | Count |
| BURHAM AVE | 114 |
| THORNWOOD MALL | 84 |
| RED OAK LN | 76 |
| BURNHAM DR | 74 |
| UNIVERSITY PKY | 46 |
| CENTRAL | 42 |
| CENTRAL AVE | 40 |
| WHITE OAK LN | 40 |
| BLACKHAWK DR | 38 |
| SANDRA DR | 38 |
| UNION DR | 36 |
| BURNHAM | 32 |
| HICKORY CREEK DR | 28 |
| SAMSON DR | 28 |
| CIRCLE DR | 26 |
| CORDOBA | 26 |
| GOVERNORS HWY | 26 |
| SULLIVAN LN | 24 |
| SANDRA | 22 |
| GREENBRIAR | 20 |
| PIN OAK LN | 20 |
| RED OAK LN. | 20 |
| WESTERN AVE | 20 |
| FEDERAL SIGNAL DR | 18 |
| UNIVERSITY DR | 18 |
| AMHERST LN | 16 |
| BURNHAM AVE | 16 |
| CRAWFORD AVE | 16 |
| IRVING PL | 16 |
| STUENKEL RD | 16 |
2002 - 2018 National Fire Incident Reporting System (NFIRS) incidents
- Incident types reported to NFIRS in University Park, IL
- 4,25747.0%Rescue & EMS
- 1,20613.3%Good Intent Call
- 1,15512.8%False Alarm
- 98910.9%Fire
- 7268.0%Service Call
- 6747.4%Hazardous Condition
- 320.4%Special Incident
- Fire incident types reported to NFIRS in University Park, IL
- 66166.8%Structure Fires
- 13113.2%Other
- 12712.8%Outside Fires
- 707.1%Mobile Property/Vehicle Fires
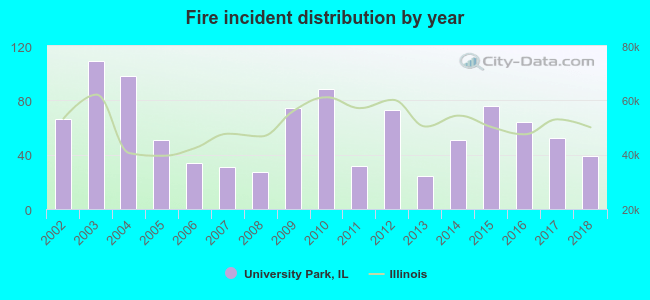 According to the data from the years 2002 - 2018 the average number of fire incidents per year is 58. The highest number of reported fires - 109 took place in 2003, and the least - 24 in 2013. The data has a decreasing trend.
The average number of yearly fire incidents per 10k residents in University Park, IL compared to nearest cities:
(Note: Based on data for the last 3 years, including only cities with population 5,000 and above)
| University Park: | 72.8 |
| Monee: | 131.9 |
| Park Forest: | 45.2 |
| Richton Park: | 46.3 |
| Steger: | 37.3 |
| Crete: | 116.7 |
| Matteson: | 55.2 |
| Olympia Fields: | 19.8 |
| Chicago Heights: | 29.5 |
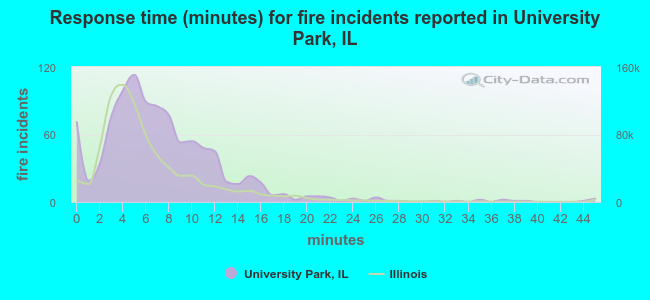 The median response time based on all reported fire incidents is 6 minutes. This is similar to the Illinois median value.
The median response time in University Park, IL compared to nearest cities:
(Note: Based on data for all years, including only cities with at least 500 fire incidents)
| University Park: | 6 minutes |
| Monee: | 6 minutes |
| Park Forest: | 5 minutes |
| Richton Park: | 6 minutes |
| Steger: | 5 minutes |
| Crete: | 6 minutes |
| Matteson: | 6 minutes |
| Chicago Heights: | 4 minutes |
| Flossmoor: | 6 minutes |
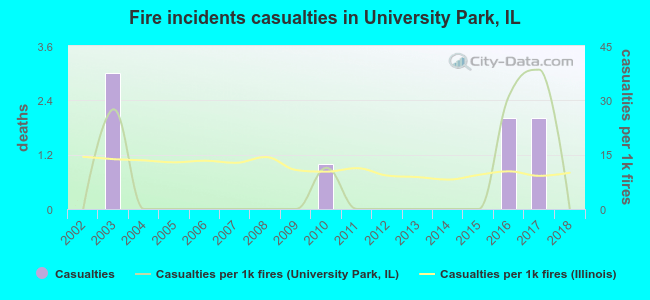 Based on the data from the years 2002 - 2018 the average number of fire-related yearly casualties is 0. The highest number of reported casualties - 3 took place in 2003, and the lowest - 0 in 2002. The data has a constant trend.
The average number of casualties per 1,000 fires is 6. This indicator was the highest - 38 in 2017, and the lowest 0 in 2002. The trend for casualties per 1,000 fires is constant. Compared to the Illinois value the number of casualties per 1,000 fires is lower.
Based on the data from the years 2002 - 2018 the average number of fire-related yearly casualties is 0. The highest number of reported casualties - 3 took place in 2003, and the lowest - 0 in 2002. The data has a constant trend.
The average number of casualties per 1,000 fires is 6. This indicator was the highest - 38 in 2017, and the lowest 0 in 2002. The trend for casualties per 1,000 fires is constant. Compared to the Illinois value the number of casualties per 1,000 fires is lower.Casualties per 1,000 incidents in University Park, IL compared to nearest cities:
(Note: Based on data for all years, including only cities with at least 500 fire incidents)
| University Park: | 8.1 |
| Monee: | 3.9 |
| Park Forest: | 37.5 |
| Richton Park: | 6.1 |
| Steger: | 6.8 |
| Crete: | 4.3 |
| Matteson: | 21.6 |
| Chicago Heights: | 9.6 |
| Flossmoor: | 17.8 |
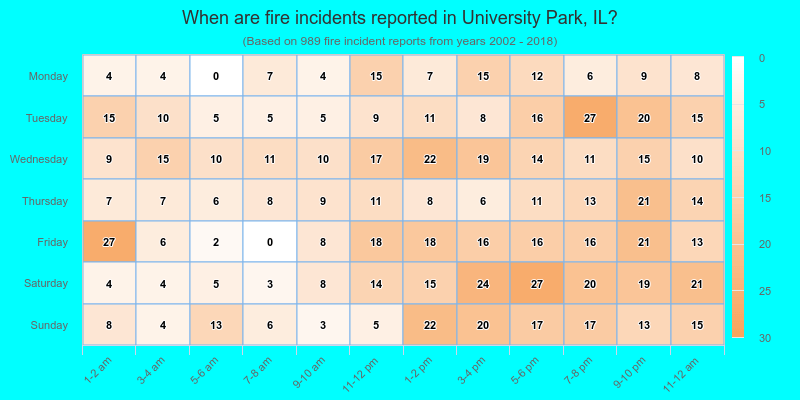
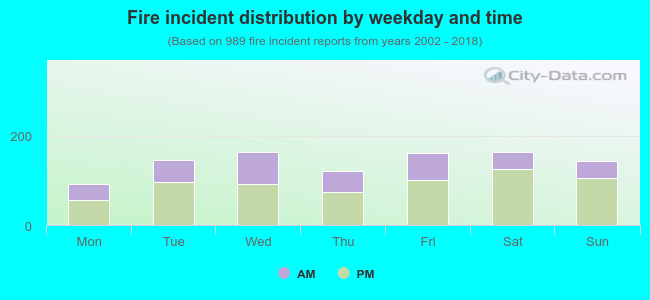 34.5% incidents where reported in the morning and 65.5% in the evening. The most fires (16.6%) took place on Saturday, and the least (9.2%) on Monday.
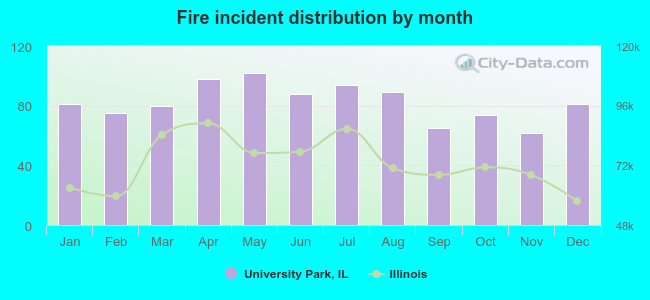 According to the 989 fires from years 2002 - 2018 most fires (10.3%) took place during May, and the least (6.3%) in November.
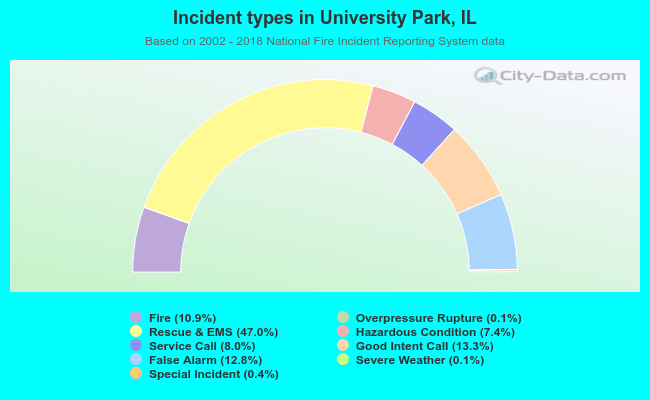 Out of all 9,052 cases reported during the years 2002 - 2018, the most belonged to the categories: Rescue & EMS (47.0%), Good Intent Call (13.3%), and False Alarm (12.8%).
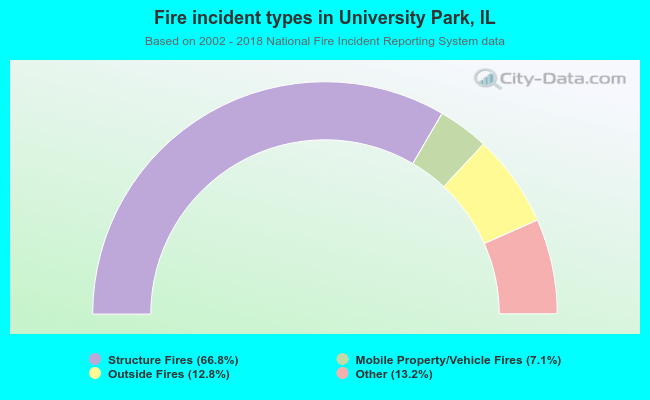 When looking into fire subcategories, the most reports belonged to: Structure Fires (66.8%), and Other (13.2%).