Park Forest: Fire Incidents, Illinois (IL)
Where are fire incidents reported in Park Forest, IL
Something went wrong! Please refresh the page.
| Fire incidents reported | |
|---|---|
| Sreet name | Count |
| WESTERN AVE | 158 |
| LAKEWOOD BLVD | 96 |
| SAUK TRAIL | 86 |
| ORCHARD DR | 70 |
| ALLEGHENY ST | 52 |
| ARBOR TRL | 50 |
| INDIANWOOD BLVD | 48 |
| SOUTH ST | 40 |
| ORCHARD | 38 |
| WESTWOOD DR | 38 |
| WILSON ST | 38 |
| ALGONQUIN ST | 36 |
| BLACKHAWK DR | 36 |
| WINNEBAGO ST | 36 |
| ASH ST | 30 |
| ILLINOIS ST | 30 |
| MARQUETTE ST | 30 |
| SOMONAUK ST | 30 |
| APACHE ST | 28 |
| FOREST BLVD | 28 |
| MAIN ST | 28 |
| MONEE RD | 28 |
| GRANT ST | 26 |
| SYCAMORE DR | 26 |
| ARCADIA ST | 24 |
| DOGWOOD ST | 24 |
| INDIANA ST | 24 |
| JUNIPER ST | 24 |
| MIAMI ST | 24 |
| PARK ST | 24 |
| Other | 216 |
2002 - 2018 National Fire Incident Reporting System (NFIRS) incidents
- Incident types reported to NFIRS in Park Forest, IL
- 13,13863.4%Rescue & EMS
- 2,46611.9%False Alarm
- 1,5907.7%Hazardous Condition
- 1,4667.1%Fire
- 1,1135.4%Good Intent Call
- 9174.4%Service Call
- Fire incident types reported to NFIRS in Park Forest, IL
- 94364.3%Structure Fires
- 28519.4%Outside Fires
- 14610.0%Mobile Property/Vehicle Fires
- 926.3%Other
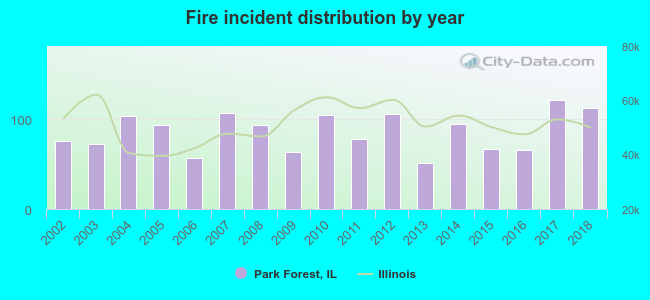 Based on the data from the years 2002 - 2018 the average number of fires per year is 86. The highest number of fire incidents - 121 took place in 2017, and the least - 51 in 2013. The data has an increasing trend.
The average number of yearly fire incidents per 10k residents in Park Forest, IL compared to nearest cities:
(Note: Based on data for the last 3 years, including only cities with population 5,000 and above)
| Park Forest: | 45.2 |
| Richton Park: | 46.3 |
| Olympia Fields: | 19.8 |
| Steger: | 37.3 |
| Chicago Heights: | 29.5 |
| University Park: | 72.8 |
| Matteson: | 55.2 |
| Flossmoor: | 55.0 |
| Crete: | 116.7 |
 The median response time based on all reported fire incidents is 5 minutes. This is similar to the Illinois median value.
The median response time in Park Forest, IL compared to nearest cities:
(Note: Based on data for all years, including only cities with at least 500 fire incidents)
| Park Forest: | 5 minutes |
| Richton Park: | 6 minutes |
| Steger: | 5 minutes |
| Chicago Heights: | 4 minutes |
| University Park: | 6 minutes |
| Matteson: | 6 minutes |
| Flossmoor: | 6 minutes |
| Crete: | 6 minutes |
| Homewood: | 5 minutes |
 According to the data from the years 2002 - 2018 the average number of fire-related yearly deaths is 0. The highest number of deaths - 3 took place in 2012, and the lowest - 0 in 2002. The data has a constant trend.
 According to the reports from the years 2002 - 2018 the average number of fire-related yearly casualties is 3. The highest number of reported casualties - 6 took place in 2004, and the lowest - 0 in 2006. The data has a decreasing trend.
The average number of casualties per 1,000 fires is 40. This indicator was the highest - 98 in 2013, and the lowest 0 in 2006. The trend for injuries per 1,000 fires is declining. Compared to the Illinois value the number of injuries per 1,000 fires is much higher.
According to the reports from the years 2002 - 2018 the average number of fire-related yearly casualties is 3. The highest number of reported casualties - 6 took place in 2004, and the lowest - 0 in 2006. The data has a decreasing trend.
The average number of casualties per 1,000 fires is 40. This indicator was the highest - 98 in 2013, and the lowest 0 in 2006. The trend for injuries per 1,000 fires is declining. Compared to the Illinois value the number of injuries per 1,000 fires is much higher.Casualties per 1,000 incidents in Park Forest, IL compared to nearest cities:
(Note: Based on data for all years, including only cities with at least 500 fire incidents)
| Park Forest: | 37.5 |
| Richton Park: | 6.1 |
| Steger: | 6.8 |
| Chicago Heights: | 9.6 |
| University Park: | 8.1 |
| Matteson: | 21.6 |
| Flossmoor: | 17.8 |
| Crete: | 4.3 |
| Homewood: | 19.1 |
 32.6% incidents where reported in the morning and 67.4% in the evening. The most fires (17.2%) took place on Sunday, and the least (12.8%) on Wednesday.
 Based on the 1,466 fires from years 2002 - 2018 most fires (11.3%) took place during May, and the least (5.5%) in September.
 Out of all 20,724 cases reported during the years 2002 - 2018, the most belonged to the categories: Rescue & EMS (63.4%), False Alarm (11.9%), and Hazardous Condition (7.7%).
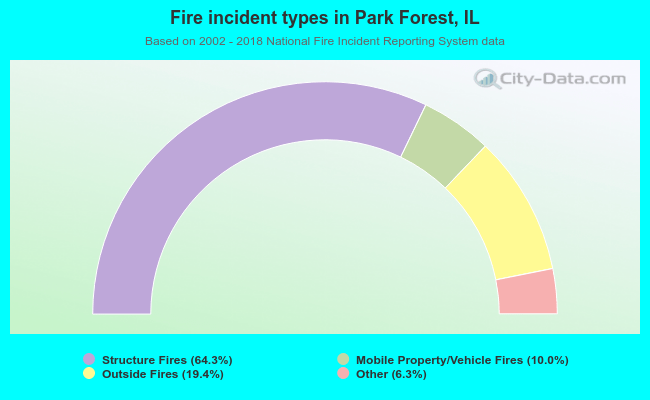 When looking into fire subcategories, the most reports belonged to: Structure Fires (64.3%), and Outside Fires (19.4%).