Steger: Fire Incidents, Illinois (IL)
Where are fire incidents reported in Steger, IL
Something went wrong! Please refresh the page.
| Fire incidents reported | |
|---|---|
| Sreet name | Count |
| 34TH ST | 148 |
| CHICAGO RD | 110 |
| UNION AVE | 84 |
| KINGS RD | 64 |
| RICHTON RD | 60 |
| MORGAN | 54 |
| MORGAN ST | 50 |
| STATE ST | 48 |
| 31ST PL | 44 |
| 35TH ST | 36 |
| 34TH | 26 |
| OAKLAND DR | 26 |
| STEGER RD | 26 |
| COTTAGE GROVE | 24 |
| HALSTED ST | 24 |
| UNION | 24 |
| BUTLER ST | 22 |
| PEORIA ST | 22 |
| 30TH PL | 20 |
| 31ST ST | 20 |
| COTTAGE GROVE ST | 20 |
| FLORENCE AVE | 20 |
| GREEN ST | 20 |
| PHILLIPS AVE | 20 |
| STATE | 20 |
| COTTAGE GROVE AVE | 18 |
| SAUK TRAIL | 18 |
| CARPENTER ST | 16 |
| PHILLIPS | 16 |
| SHERMAN RD | 16 |
2002 - 2018 National Fire Incident Reporting System (NFIRS) incidents
- Incident types reported to NFIRS in Steger, IL
- 2,09039.4%Rescue & EMS
- 1,03719.5%Fire
- 93717.7%Service Call
- 57510.8%Hazardous Condition
- 4478.4%Good Intent Call
- 1673.1%False Alarm
- 440.8%Special Incident
- 60.1%Severe Weather
- Fire incident types reported to NFIRS in Steger, IL
- 52650.7%Structure Fires
- 26825.8%Other
- 14914.4%Outside Fires
- 949.1%Mobile Property/Vehicle Fires
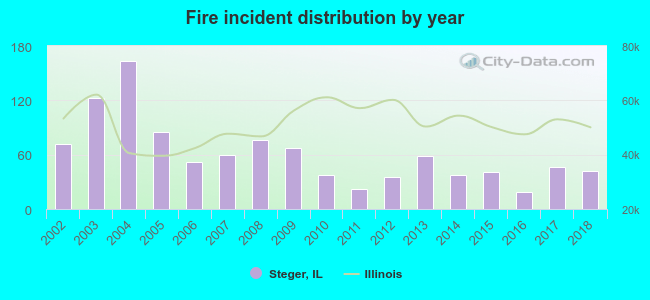 According to the data from the years 2002 - 2018 the average number of fires per year is 61. The highest number of reported fire incidents - 163 took place in 2004, and the least - 19 in 2016. The data has a decreasing trend.
The average number of yearly fire incidents per 10k residents in Steger, IL compared to nearest cities:
(Note: Based on data for the last 3 years, including only cities with population 5,000 and above)
| Steger: | 37.3 |
| Crete: | 116.7 |
| Chicago Heights: | 29.5 |
| Park Forest: | 45.2 |
| Sauk Village: | 61.3 |
| University Park: | 72.8 |
| Olympia Fields: | 19.8 |
| Richton Park: | 46.3 |
| Glenwood: | 46.1 |
 The median response time based on all reported fire incidents is 5 minutes. This is similar to the Illinois median value.
The median response time in Steger, IL compared to nearest cities:
(Note: Based on data for all years, including only cities with at least 500 fire incidents)
| Steger: | 5 minutes |
| Crete: | 6 minutes |
| Chicago Heights: | 4 minutes |
| Park Forest: | 5 minutes |
| Sauk Village: | 8 minutes |
| University Park: | 6 minutes |
| Richton Park: | 6 minutes |
| Glenwood: | 5 minutes |
| Flossmoor: | 6 minutes |
 According to the data from the years 2002 - 2018 the average number of fire-related yearly casualties is 0. The highest number of reported casualties - 2 took place in 2002, and the lowest - 0 in 2005. The data has a decreasing trend.
The average number of injuries per 1,000 fire incidents is 5. This indicator was the highest - 28 in 2002, and the lowest 0 in 2005. The trend for injuries per 1,000 incidents is decreasing. Compared to the state value the number of casualties per 1,000 fire incidents is lower.
According to the data from the years 2002 - 2018 the average number of fire-related yearly casualties is 0. The highest number of reported casualties - 2 took place in 2002, and the lowest - 0 in 2005. The data has a decreasing trend.
The average number of injuries per 1,000 fire incidents is 5. This indicator was the highest - 28 in 2002, and the lowest 0 in 2005. The trend for injuries per 1,000 incidents is decreasing. Compared to the state value the number of casualties per 1,000 fire incidents is lower.Casualties per 1,000 incidents in Steger, IL compared to nearest cities:
(Note: Based on data for all years, including only cities with at least 500 fire incidents)
| Steger: | 6.8 |
| Crete: | 4.3 |
| Chicago Heights: | 9.6 |
| Park Forest: | 37.5 |
| Sauk Village: | 5.5 |
| University Park: | 8.1 |
| Richton Park: | 6.1 |
| Glenwood: | 3.1 |
| Flossmoor: | 17.8 |
 35.7% incidents where reported in the morning and 64.3% in the evening. The most fires (19.0%) took place on Thursday, and the least (12.2%) on Friday.
 Based on the 1,037 fires from years 2002 - 2018 most fires (10.6%) took place during May, and the least (5.7%) in March.
 Out of all 5,307 cases reported during the years 2002 - 2018, the most belonged to the categories: Rescue & EMS (39.4%), Fire (19.5%), and Service Call (17.7%).
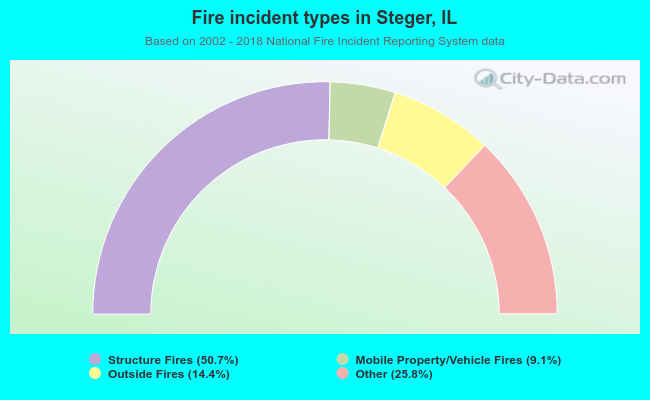 When looking into fire subcategories, the most incidents belonged to: Structure Fires (50.7%), and Other (25.8%).