Lincoln: Fire Incidents, California (CA)
Where are fire incidents reported in Lincoln, CA
Something went wrong! Please refresh the page.
|
| |||||||||||||||||||||||||||||||||||||||||||||||||||||||||||||||||||||||||||||||||||||||||||||||||||||||||||||
| Other | 66 | |||||||||||||||||||||||||||||||||||||||||||||||||||||||||||||||||||||||||||||||||||||||||||||||||||||||||||||
2005 - 2018 National Fire Incident Reporting System (NFIRS) incidents
- Incident types reported to NFIRS in Lincoln, CA
- 4,35163.8%Rescue & EMS
- 6789.9%Good Intent Call
- 6589.7%Fire
- 6579.6%Service Call
- 3254.8%False Alarm
- 1382.0%Hazardous Condition
- Fire incident types reported to NFIRS in Lincoln, CA
- 39259.6%Outside Fires
- 17025.8%Structure Fires
- 619.3%Mobile Property/Vehicle Fires
- 355.3%Other
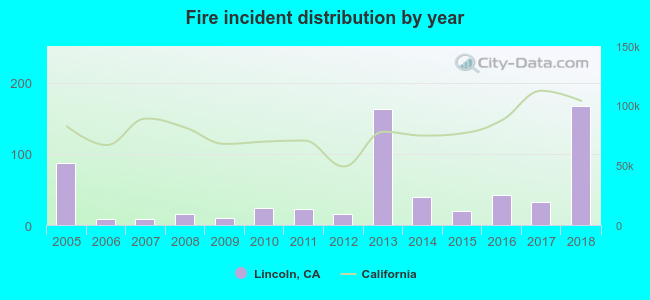 According to the data from the years 2005 - 2018 the average number of fires per year is 47. The highest number of fire incidents - 168 took place in 2018, and the least - 9 in 2006. The data has a growing trend.
The average number of yearly fire incidents per 10k residents in Lincoln, CA compared to nearest cities:
(Note: Based on data for the last 3 years, including only cities with population 5,000 and above)
| Lincoln: | 17.6 |
| Rocklin: | 17.7 |
| Loomis: | 98.1 |
| Roseville: | 22.8 |
| Granite Bay: | 28.4 |
| Auburn: | 84.0 |
| Antelope: | 11.7 |
| Citrus Heights: | 28.1 |
| Orangevale: | 13.5 |
 The median response time based on all reported fire incidents is 9 minutes. This is higher compared to the California median value.
The median response time in Lincoln, CA compared to nearest cities:
(Note: Based on data for all years, including only cities with at least 500 fire incidents)
| Lincoln: | 9 minutes |
| Rocklin: | 6 minutes |
| Loomis: | 8 minutes |
| Roseville: | 5 minutes |
| Granite Bay: | 7 minutes |
| Auburn: | 6 minutes |
| Antelope: | 5 minutes |
| Citrus Heights: | 5 minutes |
| Orangevale: | 5 minutes |
 31.5% incidents where reported in the morning and 68.5% in the evening. The most fires (16.9%) took place on Sunday, and the least (11.9%) on Thursday.
 According to the 658 fire incident reports from years 2005 - 2018 most fires (16.4%) took place during July, and the least (2.4%) in March.
 Out of all 6,817 cases reported during the years 2005 - 2018, the most belonged to the categories: Rescue & EMS (63.8%), Good Intent Call (9.9%), and Fire (9.7%).
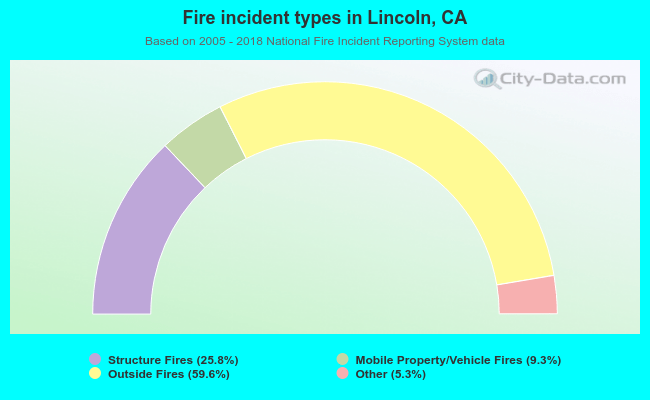 When looking into fire subcategories, the most incidents belonged to: Outside Fires (59.6%), and Structure Fires (25.8%).