Levittown: Fire Incidents, Pennsylvania (PA)
Where are fire incidents reported in Levittown, PA
Something went wrong! Please refresh the page.
| Fire incidents reported | |
|---|---|
| Sreet name | Count |
| PENN VALLEY RD | 448 |
| NEW FALLS RD | 158 |
| MILL CREEK RD | 98 |
| MILLCREEK RD | 86 |
| MARION CRT | 72 |
| LAKESIDE DR | 62 |
| HAINES RD | 60 |
| KENWOOD DR | 58 |
| MARION CT | 54 |
| VETERANS HWY | 50 |
| BRISTOL PIKE | 46 |
| NORTH PARK DR | 44 |
| WOODBOURNE RD | 44 |
| OXFORD VALLEY RD | 42 |
| RT 13 | 42 |
| BIRCH DR | 40 |
| GREENBROOK DR | 40 |
| WILLOW DR | 40 |
| LEVITTOWN PKY | 38 |
| PENNSYLVANIA TPKE | 38 |
| EMILIE RD | 28 |
| MAGNOLIA DR | 28 |
| PINEWOOD DR | 28 |
| THORNRIDGE DR | 28 |
| TRENTON RD | 28 |
| BRISTOL OXFORD VALLEY RD | 26 |
| FORD RD | 24 |
| RADCLIFFE ST | 24 |
| EDGELY RD | 22 |
| EVERTURN LA | 22 |
| Other | 488 |
2003 - 2018 National Fire Incident Reporting System (NFIRS) incidents
- Incident types reported to NFIRS in Levittown, PA
- 2,30639.2%Fire
- 1,06618.1%Good Intent Call
- 98516.8%Hazardous Condition
- 86514.7%False Alarm
- 5569.5%Rescue & EMS
- 731.2%Service Call
- 180.3%Overpressure Rupture
- 60.1%Special Incident
- Fire incident types reported to NFIRS in Levittown, PA
- 1,60569.6%Structure Fires
- 38116.5%Outside Fires
- 1938.4%Other
- 1275.5%Mobile Property/Vehicle Fires
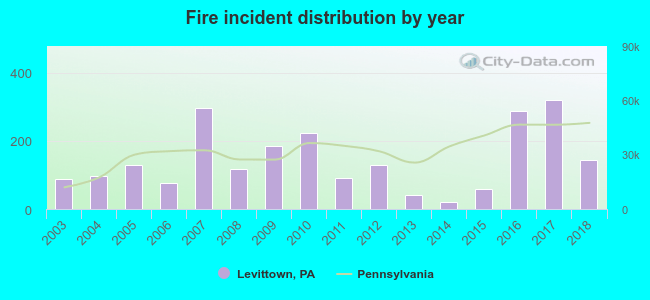 Based on the data from the years 2003 - 2018 the average number of fire incidents per year is 144. The highest number of fires - 319 took place in 2017, and the least - 22 in 2014. The data has an increasing trend.
The average number of yearly fire incidents per 10k residents in Levittown, PA compared to nearest cities:
(Note: Based on data for the last 3 years, including only cities with population 5,000 and above)
| Levittown: | 47.2 |
| Fairless Hills: | 46.9 |
| Bristol: | 101.1 |
| Croydon: | 30.2 |
| Morrisville: | 86.5 |
| Richboro: | 9.1 |
| Hatboro: | 25.1 |
| Willow Grove: | 12.9 |
| Horsham: | 23.8 |
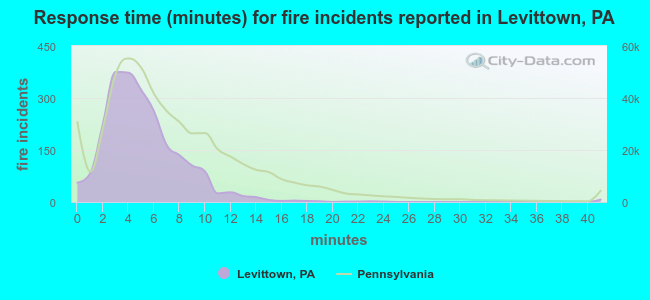 The median response time based on all reported fire incidents is 5 minutes. This is lower than the state median value.
The median response time in Levittown, PA compared to nearest cities:
(Note: Based on data for all years, including only cities with at least 500 fire incidents)
| Levittown: | 5 minutes |
| Florence: | 8 minutes |
| Bristol: | 5 minutes |
| Langhorne: | 5 minutes |
| Croydon: | 4 minutes |
| Morrisville: | 6 minutes |
| Trenton: | 4 minutes |
| Bordentown: | 7 minutes |
| Ewing: | 6 minutes |
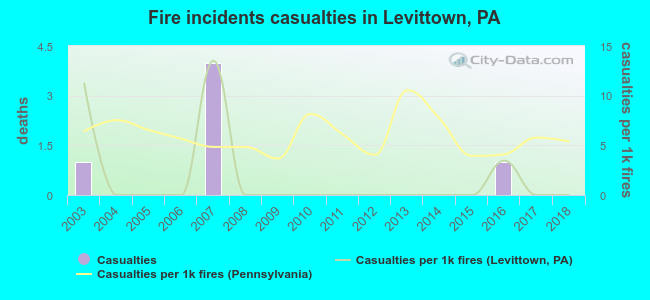 Based on the reports from the years 2003 - 2018 the average number of fire-related yearly casualties is 0. The highest number of reported injuries - 4 took place in 2007, and the lowest - 0 in 2004. The data has a decreasing trend.
The average number of injuries per 1,000 fire incidents is 2. This indicator was the highest - 14 in 2007, and the lowest 0 in 2004. The trend for casualties per 1,000 fires is decreasing. Compared to the state value the number of casualties per 1,000 fires is much lower.
Based on the reports from the years 2003 - 2018 the average number of fire-related yearly casualties is 0. The highest number of reported injuries - 4 took place in 2007, and the lowest - 0 in 2004. The data has a decreasing trend.
The average number of injuries per 1,000 fire incidents is 2. This indicator was the highest - 14 in 2007, and the lowest 0 in 2004. The trend for casualties per 1,000 fires is decreasing. Compared to the state value the number of casualties per 1,000 fires is much lower.Casualties per 1,000 incidents in Levittown, PA compared to nearest cities:
(Note: Based on data for all years, including only cities with at least 500 fire incidents)
| Levittown: | 2.6 |
| Florence: | 9.5 |
| Bristol: | 1.1 |
| Langhorne: | 1.8 |
| Croydon: | 0.0 |
| Morrisville: | 0.0 |
| Trenton: | 9.2 |
| Bordentown: | 0.0 |
| Ewing: | 3.4 |
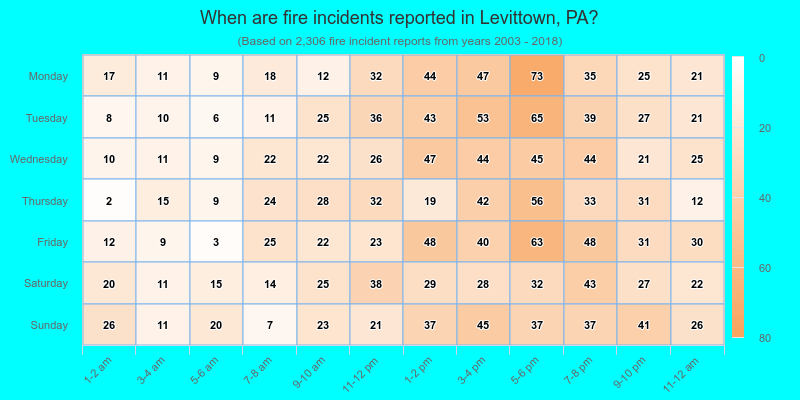
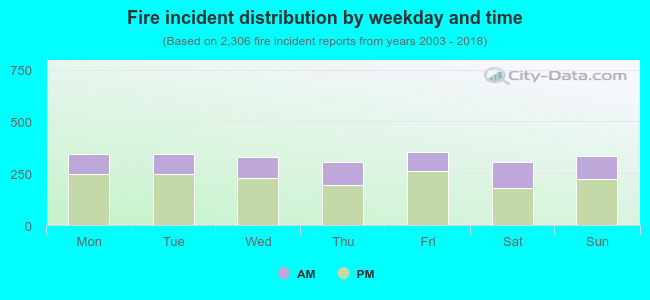 31.7% incidents where reported in the morning and 68.3% in the evening. The most fires (15.4%) took place on Friday, and the least (13.1%) on Thursday.
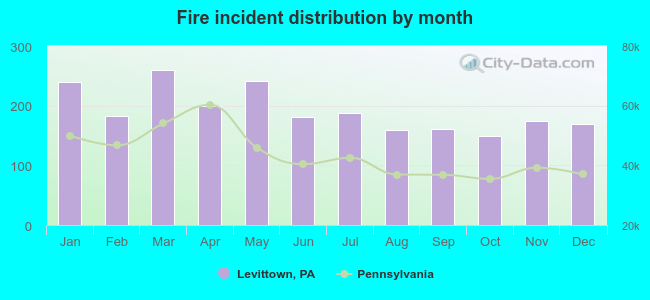 According to the 2,306 fires from years 2003 - 2018 most fires (11.3%) took place during March, and the least (6.5%) in October.
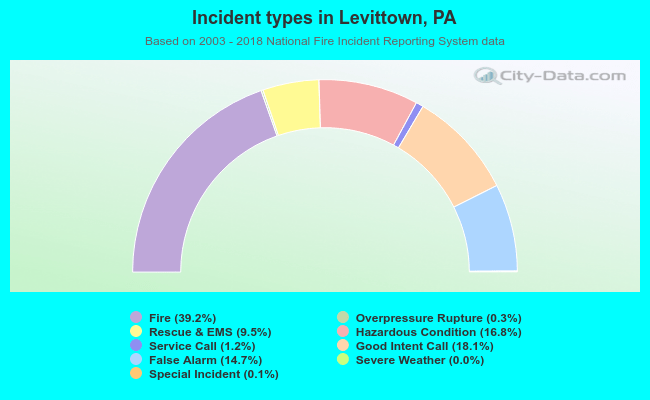 Out of all 5,876 cases reported during the years 2003 - 2018, the most belonged to the categories: Fire (39.2%), Good Intent Call (18.1%), and Hazardous Condition (16.8%).
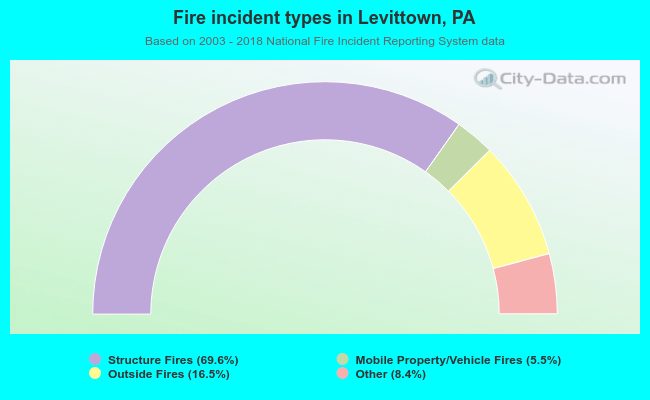 When looking into fire subcategories, the most reports belonged to: Structure Fires (69.6%), and Outside Fires (16.5%).