Bristol: Fire Incidents, Pennsylvania (PA)
Where are fire incidents reported in Bristol, PA
Something went wrong! Please refresh the page.
| Fire incidents reported | |
|---|---|
| Sreet name | Count |
| BATH RD | 128 |
| POND ST | 110 |
| RADCLIFFE ST | 104 |
| COMMERCE CI | 102 |
| VETERANS HWY | 90 |
| BEAVER ST | 74 |
| FORD RD | 72 |
| OTTER ST | 66 |
| BATH ST | 64 |
| MILL ST | 64 |
| BRISTOL PK | 58 |
| BRISTOL PIKE | 54 |
| WINDER DR | 54 |
| BUCKLEY ST | 48 |
| COMMERCE CIRCLE CIR | 42 |
| NEWPORTVILLE RD | 42 |
| JEFFERSON AV | 40 |
| POND ST ST | 40 |
| COMMERCE CIR | 34 |
| JEFFERSON AVE AVE | 34 |
| PINE ST | 32 |
| SPRUCE ST | 32 |
| WOOD ST | 32 |
| NEW RODGERS RD | 30 |
| BEAVER DAM RD | 28 |
| FARRAGUT AV | 28 |
| LAFAYETTE ST | 26 |
| BATH RD | 24 |
| BEAVER ST ST | 24 |
| HARRISON ST | 24 |
| Other | 293 |
2003 - 2018 National Fire Incident Reporting System (NFIRS) incidents
- Incident types reported to NFIRS in Bristol, PA
- 1,89348.3%Fire
- 1,01125.8%Hazardous Condition
- 43611.1%False Alarm
- 2757.0%Rescue & EMS
- 1774.5%Good Intent Call
- 1062.7%Service Call
- 120.3%Special Incident
- 60.2%Overpressure Rupture
- Fire incident types reported to NFIRS in Bristol, PA
- 1,13359.9%Structure Fires
- 45924.2%Outside Fires
- 20410.8%Mobile Property/Vehicle Fires
- 975.1%Other
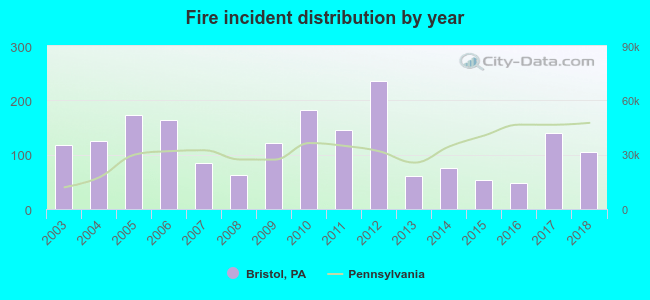 Based on the data from the years 2003 - 2018 the average number of fires per year is 118. The highest number of fire incidents - 235 took place in 2012, and the least - 48 in 2016. The data has a dropping trend.
The average number of yearly fire incidents per 10k residents in Bristol, PA compared to nearest cities:
(Note: Based on data for the last 3 years, including only cities with population 5,000 and above)
| Bristol: | 101.1 |
| Croydon: | 30.2 |
| Levittown: | 47.2 |
| Fairless Hills: | 46.9 |
| Morrisville: | 86.5 |
| Richboro: | 9.1 |
| Hatboro: | 25.1 |
| Willow Grove: | 12.9 |
| Glenside: | 70.8 |
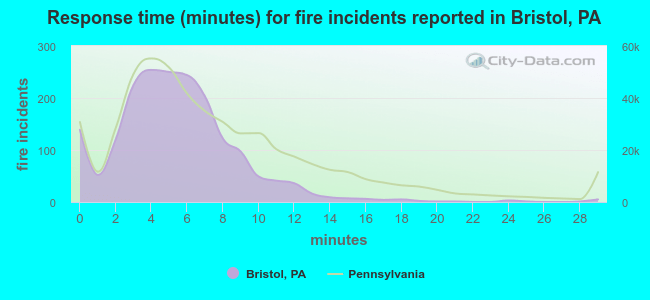 The median response time based on all reported fire incidents is 5 minutes. This is lower compared to the Pennsylvania median value.
The median response time in Bristol, PA compared to nearest cities:
(Note: Based on data for all years, including only cities with at least 500 fire incidents)
| Bristol: | 5 minutes |
| Croydon: | 4 minutes |
| Florence: | 8 minutes |
| Levittown: | 5 minutes |
| Langhorne: | 5 minutes |
| Bordentown: | 7 minutes |
| Morrisville: | 6 minutes |
| Trenton: | 4 minutes |
| Ewing: | 6 minutes |
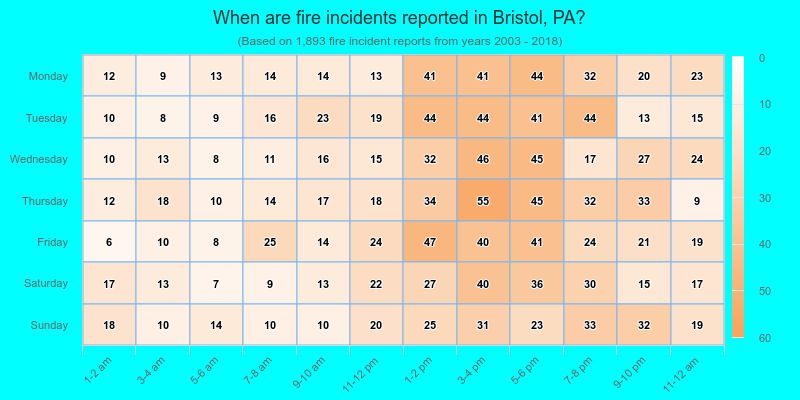
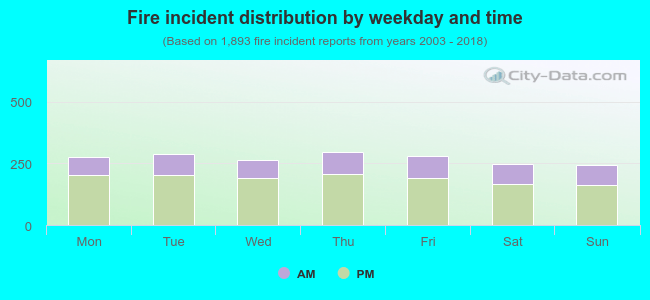 30.2% incidents where reported in the morning and 69.8% in the evening. The most fires (15.7%) took place on Thursday, and the least (12.9%) on Sunday.
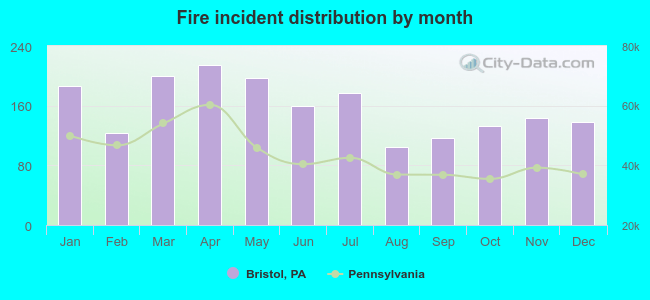 According to the 1,893 fires from years 2003 - 2018 most fires (11.3%) took place during April, and the least (5.5%) in August.
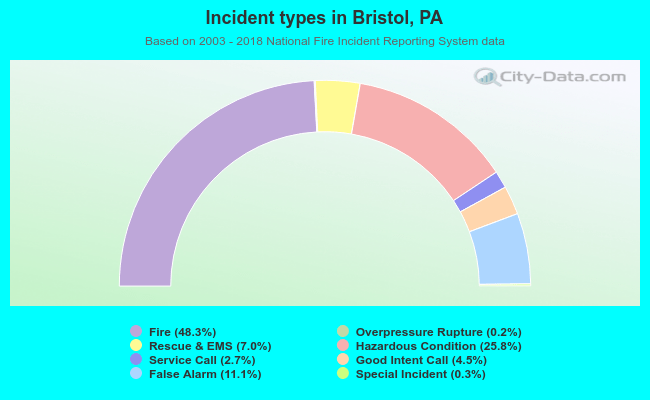 Out of all 3,916 cases reported during the years 2003 - 2018, the most belonged to the categories: Fire (48.3%), Hazardous Condition (25.8%), and False Alarm (11.1%).
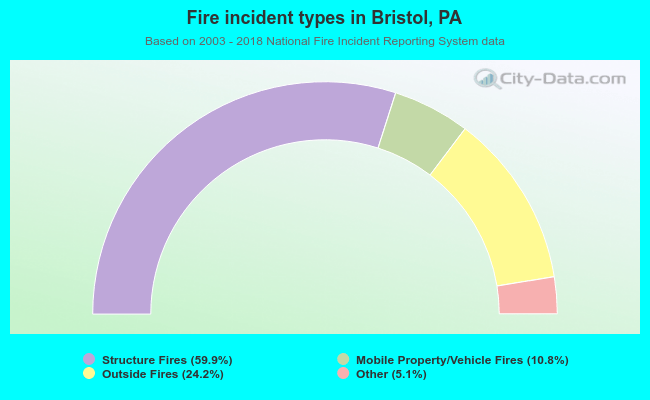 When looking into fire subcategories, the most incidents belonged to: Structure Fires (59.9%), and Outside Fires (24.2%).