Morrisville: Fire Incidents, Pennsylvania (PA)
Where are fire incidents reported in Morrisville, PA
Something went wrong! Please refresh the page.
|
| |||||||||||||||||||||||||||||||||||||||||||||||||||||||||||||||||||||||||||||||||||||||||||||||||||||||||||||
2003 - 2018 National Fire Incident Reporting System (NFIRS) incidents
- Incident types reported to NFIRS in Morrisville, PA
- 74448.7%Fire
- 26717.5%Hazardous Condition
- 25916.9%False Alarm
- 1379.0%Rescue & EMS
- 1026.7%Good Intent Call
- 161.0%Service Call
- 30.2%Special Incident
- Fire incident types reported to NFIRS in Morrisville, PA
- 56175.4%Structure Fires
- 8811.8%Outside Fires
- 496.6%Other
- 466.2%Mobile Property/Vehicle Fires
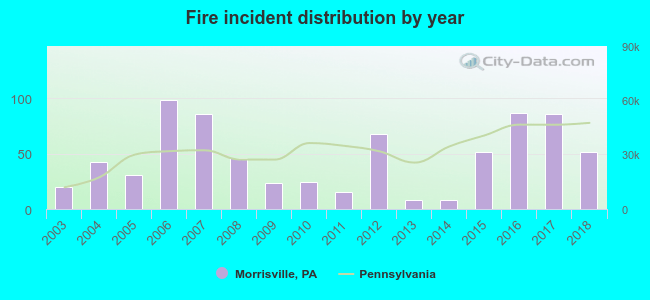 According to the data from the years 2003 - 2018 the average number of fire incidents per year is 47. The highest number of fire incidents - 98 took place in 2006, and the least - 8 in 2013. The data has a rising trend.
The average number of yearly fire incidents per 10k residents in Morrisville, PA compared to nearest cities:
(Note: Based on data for the last 3 years, including only cities with population 5,000 and above)
| Morrisville: | 86.5 |
| Fairless Hills: | 46.9 |
| Levittown: | 47.2 |
| Bristol: | 101.1 |
| Croydon: | 30.2 |
| Richboro: | 9.1 |
| Hatboro: | 25.1 |
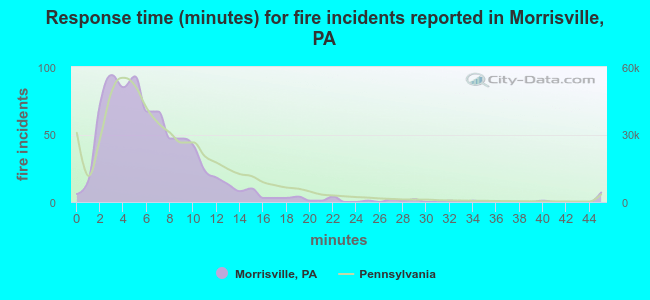 The median response time based on all reported fire incidents is 6 minutes. This is close to the state median value.
The median response time in Morrisville, PA compared to nearest cities:
(Note: Based on data for all years, including only cities with at least 500 fire incidents)
| Morrisville: | 6 minutes |
| Trenton: | 4 minutes |
| Ewing: | 6 minutes |
| Levittown: | 5 minutes |
| Bordentown: | 7 minutes |
| Florence: | 8 minutes |
| Lawrenceville: | 7 minutes |
| Langhorne: | 5 minutes |
| Bristol: | 5 minutes |
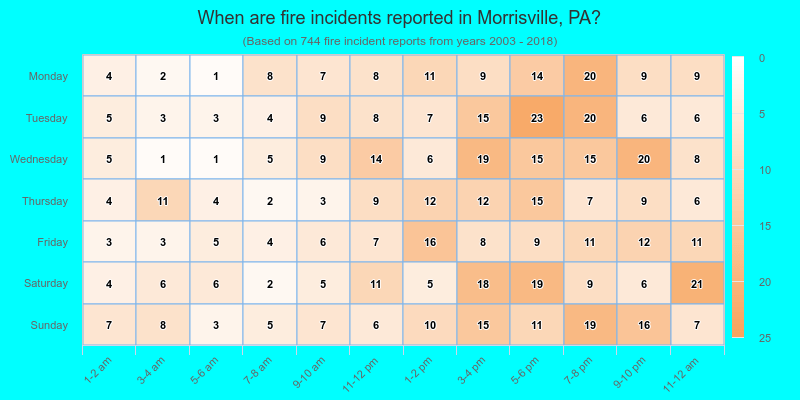
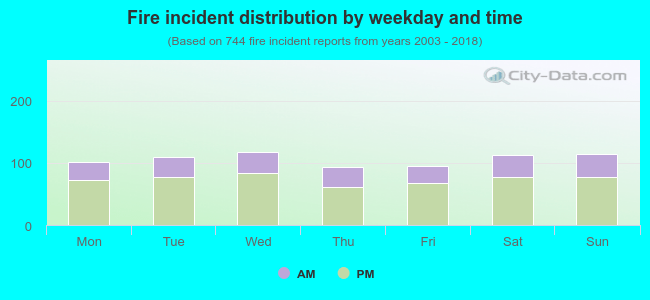 30.6% incidents where reported in the morning and 69.4% in the evening. The most fires (15.9%) took place on Wednesday, and the least (12.6%) on Thursday.
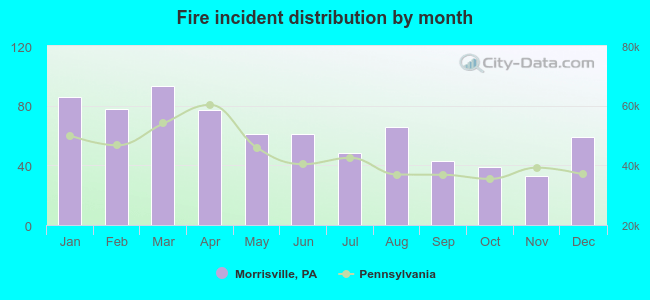 According to the 744 incident reports from years 2003 - 2018 most fires (12.5%) took place during March, and the least (4.4%) in November.
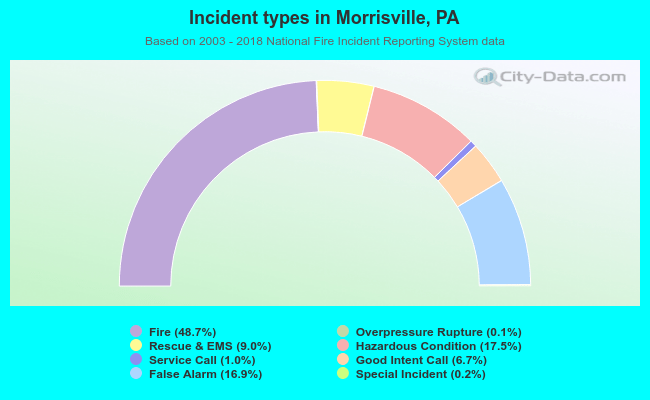 Out of all 1,529 cases reported during the years 2003 - 2018, the most belonged to the categories: Fire (48.7%), Hazardous Condition (17.5%), and False Alarm (16.9%).
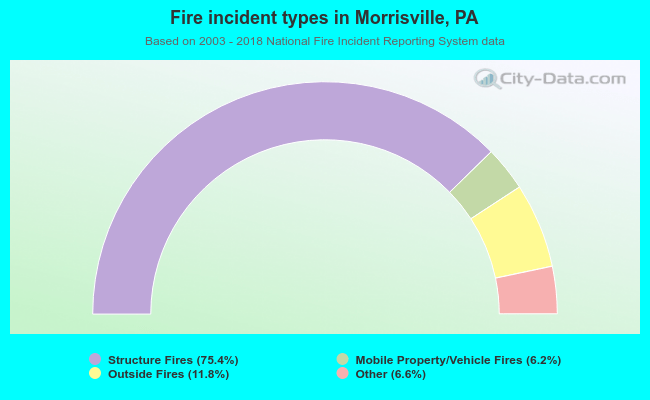 When looking into fire subcategories, the most reports belonged to: Structure Fires (75.4%), and Outside Fires (11.8%).