Horsham: Fire Incidents, Pennsylvania (PA)
Where are fire incidents reported in Horsham, PA
Something went wrong! Please refresh the page.
|
| |||||||||||||||||||||||||||||||||||||||||||||||||||||||||||||||||||||||||||||||||||||||||||||||||||||||||||||
2003 - 2018 National Fire Incident Reporting System (NFIRS) incidents
- Incident types reported to NFIRS in Horsham, PA
- 51740.8%Fire
- 40331.8%Hazardous Condition
- 12710.0%False Alarm
- 1078.4%Good Intent Call
- 806.3%Service Call
- 272.1%Rescue & EMS
- 40.3%Special Incident
- 20.2%Overpressure Rupture
- Fire incident types reported to NFIRS in Horsham, PA
- 31560.9%Structure Fires
- 12323.8%Outside Fires
- 5711.0%Mobile Property/Vehicle Fires
- 224.3%Other
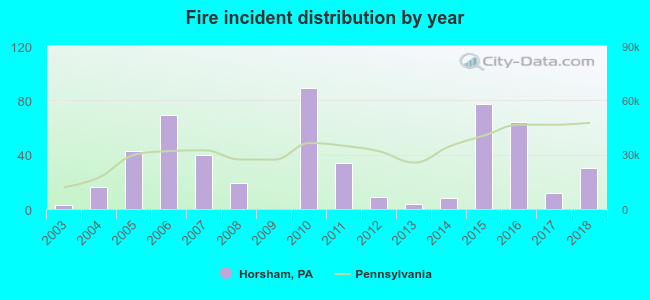 According to the data from the years 2003 - 2018 the average number of fire incidents per year is 32. The highest number of reported fire incidents - 89 took place in 2010, and the least - 0 in 2009. The data has an increasing trend.
The average number of yearly fire incidents per 10k residents in Horsham, PA compared to nearest cities:
(Note: Based on data for the last 3 years, including only cities with population 5,000 and above)
| Horsham: | 23.8 |
| Hatboro: | 25.1 |
| Maple Glen: | 3.0 |
| Willow Grove: | 12.9 |
| Fort Washington: | 36.1 |
| Ambler: | 37.4 |
| Oreland: | 24.7 |
| Glenside: | 70.8 |
| Montgomeryville: | 26.9 |
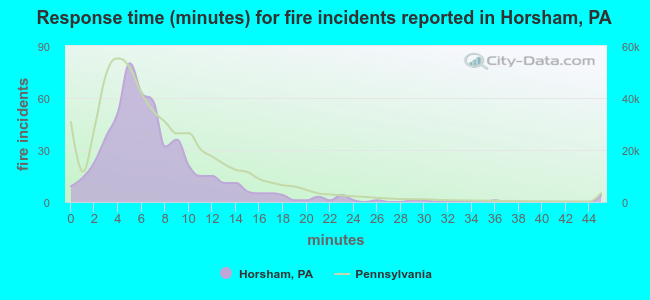 The median response time based on all reported fire incidents is 6 minutes. This is similar to the state median value.
The median response time in Horsham, PA compared to nearest cities:
(Note: Based on data for all years, including only cities with at least 500 fire incidents)
| Horsham: | 6 minutes |
| Doylestown: | 6 minutes |
| Langhorne: | 5 minutes |
| Conshohocken: | 5 minutes |
| Norristown: | 4 minutes |
| Philadelphia: | 4 minutes |
| Palmyra: | 4 minutes |
| Croydon: | 4 minutes |
| King of Prussia: | 8 minutes |
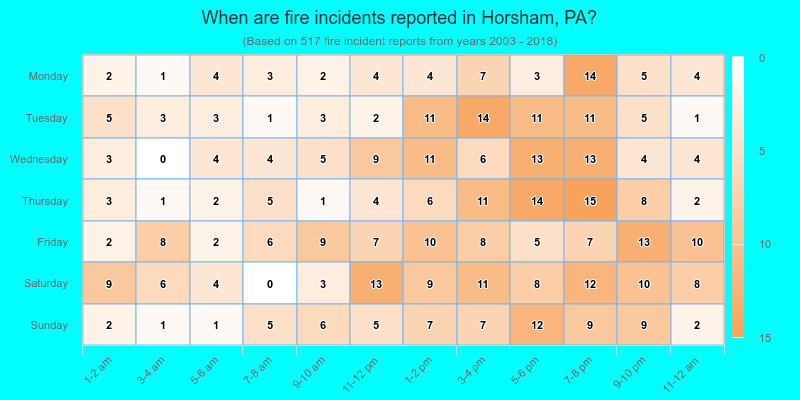
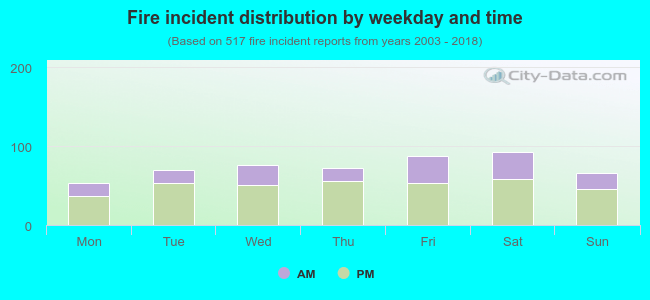 31.5% incidents where reported in the morning and 68.5% in the evening. The most fires (18.0%) took place on Saturday, and the least (10.3%) on Monday.
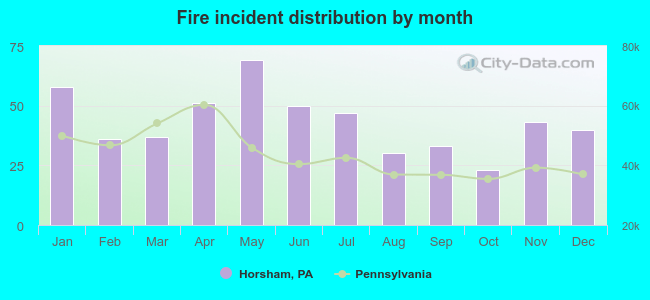 According to the 517 incident reports from years 2003 - 2018 most fires (13.3%) took place during May, and the least (4.4%) in October.
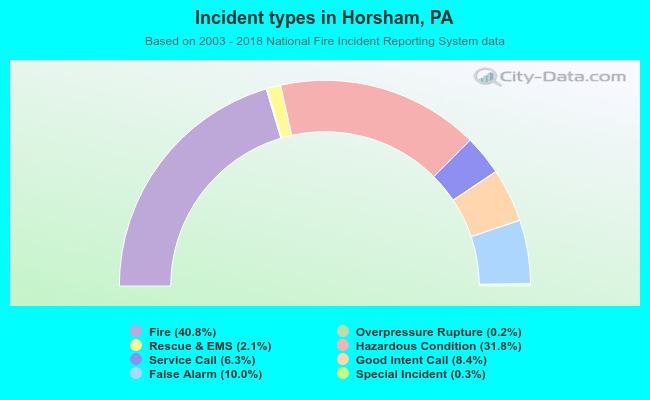 Out of all 1,267 cases reported during the years 2003 - 2018, the most belonged to the categories: Fire (40.8%), Hazardous Condition (31.8%), and False Alarm (10.0%).
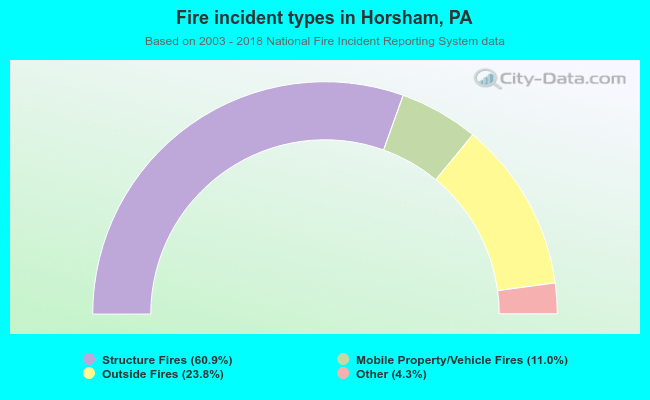 When looking into fire subcategories, the most incidents belonged to: Structure Fires (60.9%), and Outside Fires (23.8%).