Kannapolis: Fire Incidents, North Carolina (NC)
Where are fire incidents reported in Kannapolis, NC
Something went wrong! Please refresh the page.
| Fire incidents reported | |
|---|---|
| Sreet name | Count |
| CANNON BLVD | 84 |
| MAIN ST | 44 |
| I85 | 42 |
| LANE ST | 40 |
| IRISH POTATO RD | 38 |
| CENTERGROVE RD | 36 |
| WRIGHT RD | 36 |
| LAKE CIRCLE DR | 34 |
| MOORESVILLE RD | 34 |
| C ST | 30 |
| DOGWOOD DR | 30 |
| ENOCHVILLE AVE | 30 |
| I-85 | 30 |
| S CANNON BLVD | 30 |
| N CANNON BLVD | 28 |
| CAMP JULIA RD | 24 |
| ASHLAND RD | 22 |
| MOOSE RD | 20 |
| TUCKASEEGEE RD | 20 |
| 11TH ST | 18 |
| GOLDFISH RD | 18 |
| RIDGE AVE | 18 |
| S MAIN ST | 18 |
| SMITH RD | 18 |
| SUPERCENTER DR | 18 |
| 22ND ST | 16 |
| BARNCLIFF CT | 16 |
| DALE EARNHARDT BLVD | 16 |
| LANE ST | 16 |
| MULLIS RD | 16 |
| Other | 1,001 |
2002 - 2018 National Fire Incident Reporting System (NFIRS) incidents
- Incident types reported to NFIRS in Kannapolis, NC
- 16,52559.0%Rescue & EMS
- 3,46612.4%Service Call
- 3,20311.4%Good Intent Call
- 1,8416.6%Fire
- 1,6696.0%Hazardous Condition
- 1,0783.8%False Alarm
- 1300.5%Severe Weather
- 800.3%Overpressure Rupture
- Fire incident types reported to NFIRS in Kannapolis, NC
- 83745.5%Structure Fires
- 63034.2%Outside Fires
- 25914.1%Mobile Property/Vehicle Fires
- 1156.2%Other
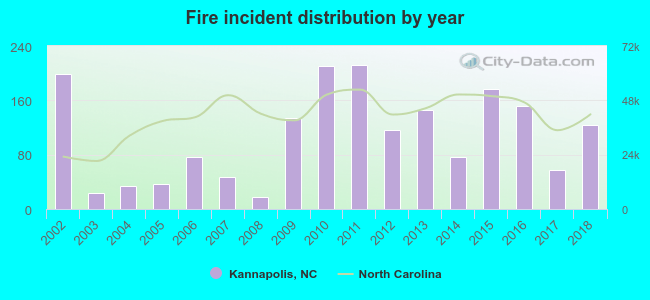 According to the data from the years 2002 - 2018 the average number of fires per year is 108. The highest number of fire incidents - 212 took place in 2011, and the least - 17 in 2008. The data has a decreasing trend.
The average number of yearly fire incidents per 10k residents in Kannapolis, NC compared to nearest cities:
(Note: Based on data for the last 3 years, including only cities with population 5,000 and above)
| Kannapolis: | 24.5 |
| Concord: | 31.7 |
| Harrisburg: | 21.2 |
| Davidson: | 19.2 |
| Mooresville: | 71.8 |
| Salisbury: | 116.0 |
| Huntersville: | 7.4 |
| Cornelius: | 14.8 |
| Mint Hill: | 26.7 |
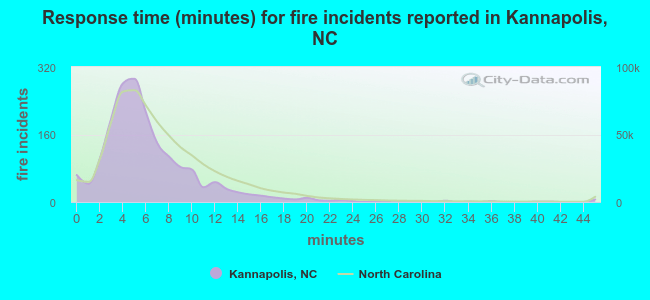 The median response time based on all reported fire incidents is 5 minutes. This is lower compared to the state median value.
The median response time in Kannapolis, NC compared to nearest cities:
(Note: Based on data for all years, including only cities with at least 500 fire incidents)
| Kannapolis: | 5 minutes |
| China Grove: | 8 minutes |
| Concord: | 5 minutes |
| Davidson: | 7 minutes |
| Rockwell: | 8 minutes |
| Mooresville: | 6 minutes |
| Salisbury: | 7 minutes |
| Huntersville: | 6 minutes |
| Cornelius: | 5 minutes |
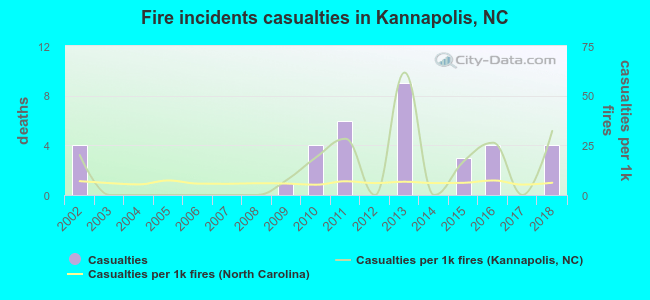 According to the reports from the years 2002 - 2018 the average number of fire-related yearly casualties is 2. The highest number of casualties - 9 took place in 2013, and the lowest - 0 in 2003. The data has a constant trend.
The average number of casualties per 1,000 fires is 12. This indicator was the highest - 62 in 2013, and the lowest 0 in 2003. The trend for casualties per 1,000 incidents is increasing. Compared to the North Carolina value the number of injuries per 1,000 fire incidents is much higher.
According to the reports from the years 2002 - 2018 the average number of fire-related yearly casualties is 2. The highest number of casualties - 9 took place in 2013, and the lowest - 0 in 2003. The data has a constant trend.
The average number of casualties per 1,000 fires is 12. This indicator was the highest - 62 in 2013, and the lowest 0 in 2003. The trend for casualties per 1,000 incidents is increasing. Compared to the North Carolina value the number of injuries per 1,000 fire incidents is much higher.Casualties per 1,000 incidents in Kannapolis, NC compared to nearest cities:
(Note: Based on data for all years, including only cities with at least 500 fire incidents)
| Kannapolis: | 19.0 |
| China Grove: | 0.0 |
| Concord: | 6.7 |
| Davidson: | 3.3 |
| Rockwell: | 0.9 |
| Mooresville: | 4.0 |
| Salisbury: | 4.6 |
| Huntersville: | 1.7 |
| Cornelius: | 1.2 |
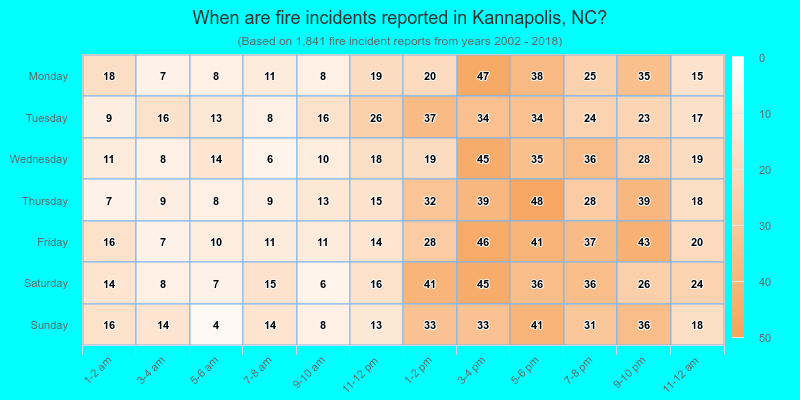
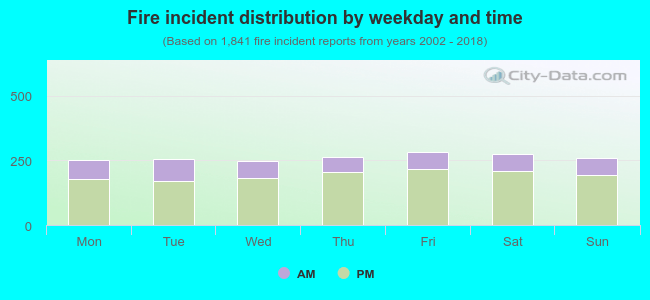 26.7% incidents where reported in the morning and 73.3% in the evening. The most fires (15.4%) took place on Friday, and the least (13.5%) on Wednesday.
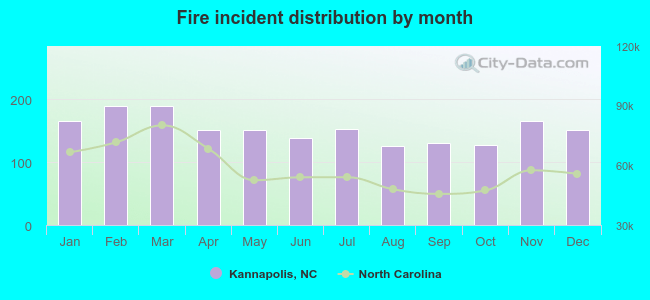 According to the 1,841 fires from years 2002 - 2018 most fires (10.3%) took place during February, and the least (6.8%) in August.
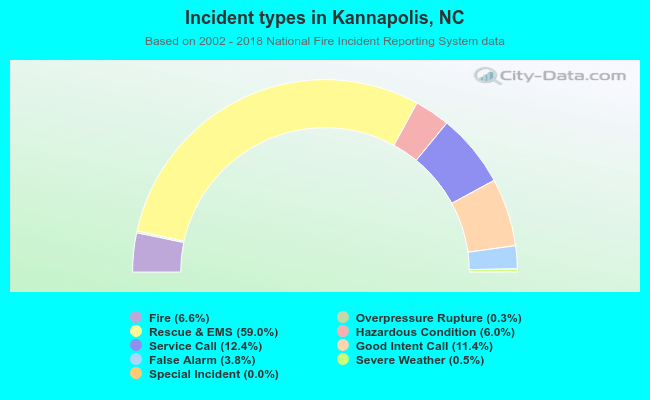 Out of all 28,005 cases reported during the years 2002 - 2018, the most belonged to the categories: Rescue & EMS (59.0%), Service Call (12.4%), and Good Intent Call (11.4%).
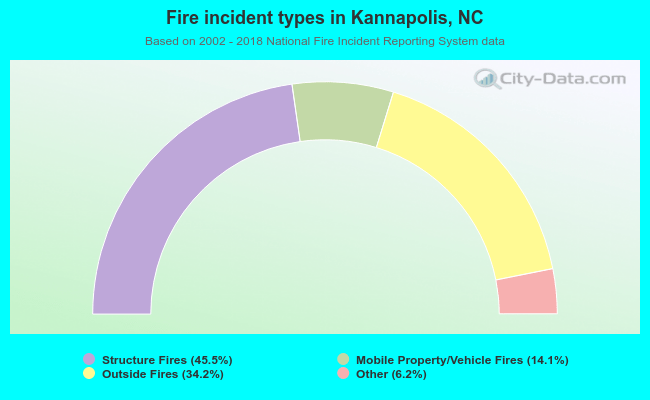 When looking into fire subcategories, the most reports belonged to: Structure Fires (45.5%), and Outside Fires (34.2%).