Cornelius: Fire Incidents, North Carolina (NC)
Where are fire incidents reported in Cornelius, NC
Something went wrong! Please refresh the page.
| Fire incidents reported | |
|---|---|
| Sreet name | Count |
| CATAWBA AVE | 78 |
| TORRENCE CHAPEL RD | 56 |
| BAILEY RD | 50 |
| STATESVILLE RD | 36 |
| INTERSTATE 77 HWY | 34 |
| JETTON RD | 34 |
| OLD STATESVILLE RD | 34 |
| STERLING BAY LN | 32 |
| MAIN ST | 28 |
| MERIDIAN ST | 28 |
| NAUTIQUE BLVD | 24 |
| VINEYARD POINT LN | 24 |
| NORMAN SHORES DR | 22 |
| KINGS POINTE DR | 20 |
| MEADOW CROSSING LN | 20 |
| ONE NORMAN BLVD | 20 |
| BRINKLEY ST | 18 |
| LIVERPOOL PKY | 18 |
| WASHAM POTTS RD | 18 |
| HENDERSON RD | 16 |
| NAUTICAL DR | 16 |
| WESTMORELAND RD | 16 |
| HICKORY ST | 14 |
| BETHEL CHURCH RD | 12 |
| MADISON VILLAGE DR | 12 |
| NORTH COVE RD | 12 |
| BELLE ISLE DR | 10 |
| COACHMANS TRCE | 10 |
| DUNMORE DR | 10 |
| FERRY ST | 10 |
| Other | 136 |
2003 - 2018 National Fire Incident Reporting System (NFIRS) incidents
- Incident types reported to NFIRS in Cornelius, NC
- 4,61847.8%Rescue & EMS
- 1,39414.4%Good Intent Call
- 98310.2%Hazardous Condition
- 97810.1%False Alarm
- 8689.0%Fire
- 7477.7%Service Call
- 340.4%Severe Weather
- 270.3%Overpressure Rupture
- 120.1%Special Incident
- Fire incident types reported to NFIRS in Cornelius, NC
- 43850.5%Structure Fires
- 31736.5%Outside Fires
- 9410.8%Mobile Property/Vehicle Fires
- 192.2%Other
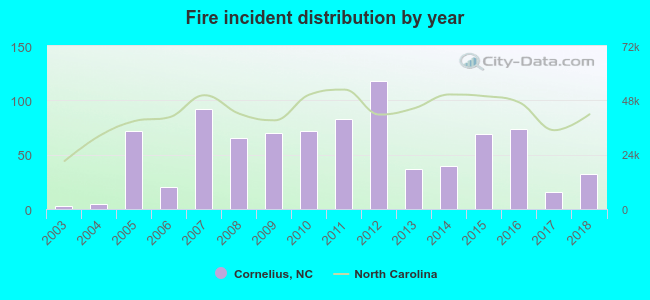 According to the data from the years 2003 - 2018 the average number of fires per year is 54. The highest number of reported fires - 118 took place in 2012, and the least - 3 in 2003. The data has an increasing trend.
The average number of yearly fire incidents per 10k residents in Cornelius, NC compared to nearest cities:
(Note: Based on data for the last 3 years, including only cities with population 5,000 and above)
| Cornelius: | 14.8 |
| Davidson: | 19.2 |
| Huntersville: | 7.4 |
| Mooresville: | 71.8 |
| Mount Holly: | 58.7 |
| Kannapolis: | 24.5 |
| Concord: | 31.7 |
| Harrisburg: | 21.2 |
| Belmont: | 50.1 |
 The median response time based on all reported fire incidents is 5 minutes. This is lower compared to the state median value.
The median response time in Cornelius, NC compared to nearest cities:
(Note: Based on data for all years, including only cities with at least 500 fire incidents)
| Cornelius: | 5 minutes |
| Davidson: | 7 minutes |
| Huntersville: | 6 minutes |
| Mooresville: | 6 minutes |
| Denver: | 6 minutes |
| Sherrills Ford: | 5 minutes |
| Stanley: | 8 minutes |
| Mount Holly: | 7 minutes |
| Kannapolis: | 5 minutes |
 31.5% incidents where reported in the morning and 68.5% in the evening. The most fires (15.2%) took place on Wednesday, and the least (12.7%) on Thursday.
 Based on the 868 fire incidents from years 2003 - 2018 most fires (10.9%) took place during April, and the least (6.2%) in September.
 Out of all 9,661 cases reported during the years 2003 - 2018, the most belonged to the categories: Rescue & EMS (47.8%), Good Intent Call (14.4%), and Hazardous Condition (10.2%).
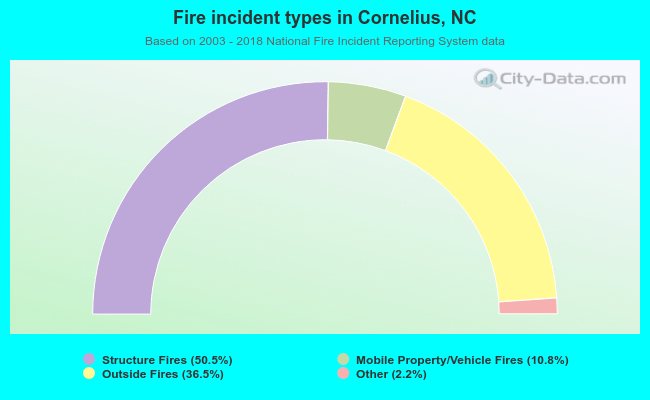 When looking into fire subcategories, the most incidents belonged to: Structure Fires (50.5%), and Outside Fires (36.5%).