Mount Holly: Fire Incidents, North Carolina (NC)
Where are fire incidents reported in Mount Holly, NC
Something went wrong! Please refresh the page.
|
| |||||||||||||||||||||||||||||||||||||||||||||||||||||||||||||||||||||||||||||||||||||||||||||||||||||||||||||
2002 - 2018 National Fire Incident Reporting System (NFIRS) incidents
- Incident types reported to NFIRS in Mount Holly, NC
- 3,88156.9%Rescue & EMS
- 90513.3%Good Intent Call
- 5938.7%Fire
- 5698.3%Service Call
- 4496.6%Hazardous Condition
- 3635.3%False Alarm
- 290.4%Severe Weather
- 200.3%Special Incident
- 160.2%Overpressure Rupture
- Fire incident types reported to NFIRS in Mount Holly, NC
- 36160.9%Structure Fires
- 13723.1%Outside Fires
- 508.4%Other
- 457.6%Mobile Property/Vehicle Fires
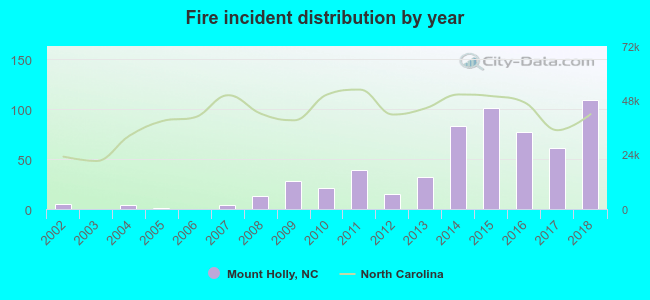 Based on the data from the years 2002 - 2018 the average number of fires per year is 35. The highest number of fires - 109 took place in 2018, and the least - 0 in 2003. The data has a rising trend.
The average number of yearly fire incidents per 10k residents in Mount Holly, NC compared to nearest cities:
(Note: Based on data for the last 3 years, including only cities with population 5,000 and above)
| Mount Holly: | 58.7 |
| Belmont: | 50.1 |
| Gastonia: | 18.4 |
| Huntersville: | 7.4 |
| Charlotte: | 21.2 |
| Cornelius: | 14.8 |
| Bessemer City: | 46.8 |
| Pineville: | 44.1 |
| Davidson: | 19.2 |
 The median response time based on all reported fire incidents is 7 minutes. This is close to the North Carolina median value.
The median response time in Mount Holly, NC compared to nearest cities:
(Note: Based on data for all years, including only cities with at least 500 fire incidents)
| Mount Holly: | 7 minutes |
| Belmont: | 7 minutes |
| Stanley: | 8 minutes |
| Dallas: | 8 minutes |
| Gastonia: | 6 minutes |
| Huntersville: | 6 minutes |
| Charlotte: | 5 minutes |
| Cornelius: | 5 minutes |
| Pineville: | 7 minutes |
 27.5% incidents where reported in the morning and 72.5% in the evening. The most fires (16.4%) took place on Thursday, and the least (11.6%) on Sunday.
 Based on the 593 fire incident reports from years 2002 - 2018 most fires (11.0%) took place during January, and the least (4.7%) in September.
 Out of all 6,825 cases reported during the years 2002 - 2018, the most belonged to the categories: Rescue & EMS (56.9%), Good Intent Call (13.3%), and Fire (8.7%).
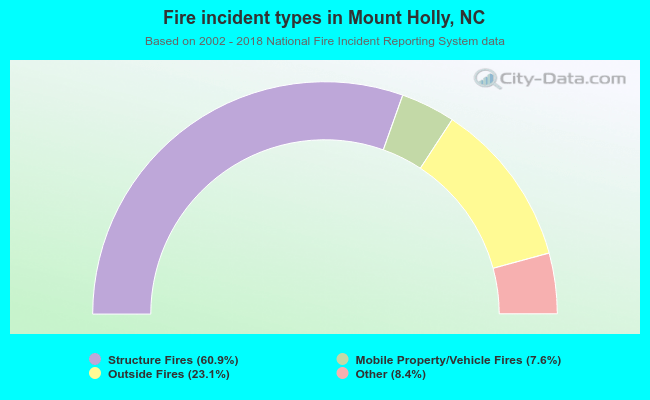 When looking into fire subcategories, the most incidents belonged to: Structure Fires (60.9%), and Outside Fires (23.1%).