Harrisburg: Fire Incidents, North Carolina (NC)
Where are fire incidents reported in Harrisburg, NC
Something went wrong! Please refresh the page.
|
| |||||||||||||||||||||||||||||||||||||||||||||||||||||||||||||||||||||||||||||||||||||||||||||||||||||||||||||
2002 - 2018 National Fire Incident Reporting System (NFIRS) incidents
- Incident types reported to NFIRS in Harrisburg, NC
- 3,44545.8%Rescue & EMS
- 1,70222.6%Good Intent Call
- 7349.8%Service Call
- 7049.4%False Alarm
- 4756.3%Fire
- 4005.3%Hazardous Condition
- 360.5%Severe Weather
- 170.2%Overpressure Rupture
- Fire incident types reported to NFIRS in Harrisburg, NC
- 20743.6%Structure Fires
- 17937.7%Outside Fires
- 6213.1%Mobile Property/Vehicle Fires
- 275.7%Other
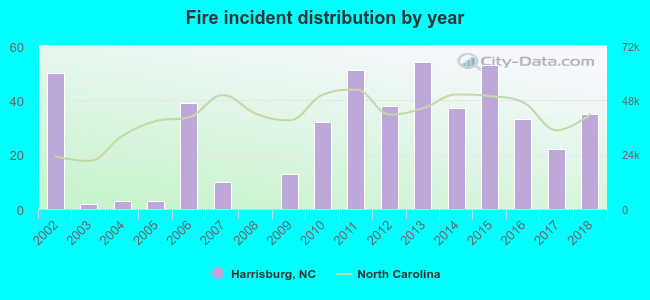 Based on the data from the years 2002 - 2018 the average number of fires per year is 28. The highest number of fires - 54 took place in 2013, and the least - 0 in 2008. The data has a dropping trend.
The average number of yearly fire incidents per 10k residents in Harrisburg, NC compared to nearest cities:
(Note: Based on data for the last 3 years, including only cities with population 5,000 and above)
| Harrisburg: | 21.2 |
| Concord: | 31.7 |
| Mint Hill: | 26.7 |
| Kannapolis: | 24.5 |
| Charlotte: | 21.2 |
| Huntersville: | 7.4 |
| Matthews: | 16.6 |
| Davidson: | 19.2 |
| Stallings: | 19.4 |

 28.4% incidents where reported in the morning and 71.6% in the evening. The most fires (17.5%) took place on Friday, and the least (12.0%) on Monday.
 Based on the 475 reports from years 2002 - 2018 most fires (11.8%) took place during February, and the least (5.5%) in August.
 Out of all 7,519 cases reported during the years 2002 - 2018, the most belonged to the categories: Rescue & EMS (45.8%), Good Intent Call (22.6%), and Service Call (9.8%).
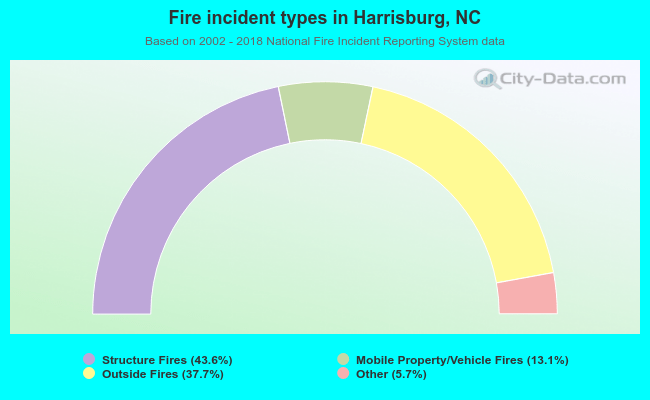 When looking into fire subcategories, the most reports belonged to: Structure Fires (43.6%), and Outside Fires (37.7%).