Salisbury: Fire Incidents, North Carolina (NC)
Where are fire incidents reported in Salisbury, NC
Something went wrong! Please refresh the page.
| Fire incidents reported | |
|---|---|
| Sreet name | Count |
| JAKE ALEXANDER BLVD | 312 |
| MAIN ST | 286 |
| INNES ST | 240 |
| STATESVILLE BLVD | 198 |
| FAITH RD | 190 |
| OLD CONCORD RD | 182 |
| BRINGLE FERRY RD | 128 |
| HEILIG RD | 114 |
| MOORESVILLE RD | 104 |
| STOKES FERRY RD | 98 |
| WEBB RD | 98 |
| OLD MOCKSVILLE RD | 94 |
| I 85 | 84 |
| FISHER ST | 82 |
| RIDGE RD | 80 |
| US 601 HWY | 80 |
| PEACH ORCHARD RD | 78 |
| LIBERTY ST | 76 |
| CHURCH ST | 74 |
| FULTON ST | 70 |
| LONG ST | 68 |
| I-85 HWY | 62 |
| LASH DR | 62 |
| LONG FERRY RD | 62 |
| MT HOPE CHURCH RD | 60 |
| I-85 | 58 |
| SHERRILLS FORD RD | 58 |
| INTERSTATE 85 HWY | 56 |
| MONROE ST | 56 |
| PEELER RD | 56 |
| Other | 2,978 |
2002 - 2018 National Fire Incident Reporting System (NFIRS) incidents
- Incident types reported to NFIRS in Salisbury, NC
- 19,54545.7%Rescue & EMS
- 6,91516.2%Good Intent Call
- 6,24414.6%Fire
- 3,7548.8%Hazardous Condition
- 3,3237.8%False Alarm
- 2,6506.2%Service Call
- 2860.7%Overpressure Rupture
- 630.1%Severe Weather
- Fire incident types reported to NFIRS in Salisbury, NC
- 3,89862.4%Structure Fires
- 1,34221.5%Outside Fires
- 77512.4%Mobile Property/Vehicle Fires
- 2293.7%Other
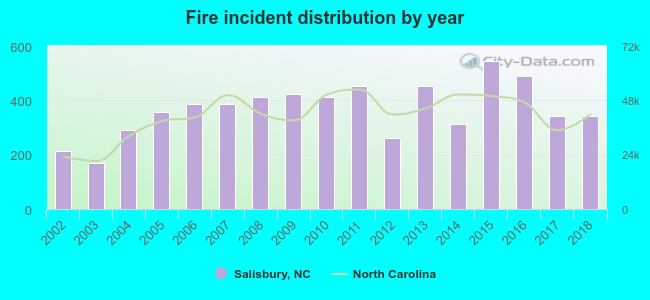 Based on the data from the years 2002 - 2018 the average number of fires per year is 367. The highest number of fires - 543 took place in 2015, and the least - 170 in 2003. The data has a rising trend.
The average number of yearly fire incidents per 10k residents in Salisbury, NC compared to nearest cities:
(Note: Based on data for the last 3 years, including only cities with population 5,000 and above)
| Salisbury: | 116.0 |
| Kannapolis: | 24.5 |
| Lexington: | 172.1 |
| Mocksville: | 327.2 |
| Concord: | 31.7 |
| Mooresville: | 71.8 |
| Davidson: | 19.2 |
| Statesville: | 105.5 |
| Clemmons: | 41.7 |
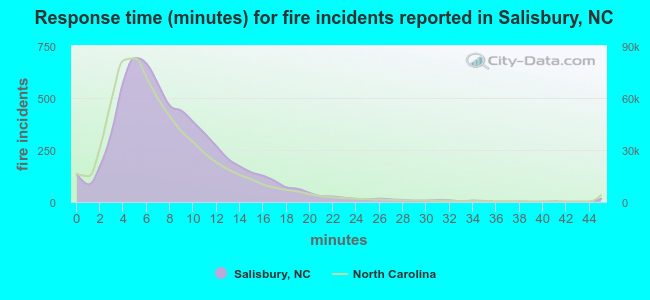 The median response time based on all reported fire incidents is 7 minutes. This is similar to the North Carolina median value.
The median response time in Salisbury, NC compared to nearest cities:
(Note: Based on data for all years, including only cities with at least 500 fire incidents)
| Salisbury: | 7 minutes |
| China Grove: | 8 minutes |
| Rockwell: | 8 minutes |
| Kannapolis: | 5 minutes |
| Lexington: | 7 minutes |
| Mocksville: | 7 minutes |
| Advance: | 7 minutes |
| Concord: | 5 minutes |
| Mooresville: | 6 minutes |
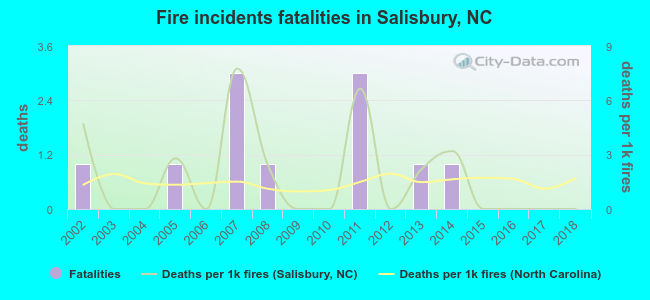 According to the reports from the years 2002 - 2018 the average number of fire-related fatalities per year is 1. The highest number of reported deaths - 3 took place in 2007, and the lowest - 0 in 2003. The data has a decreasing trend.
The average number of fatalities per 1,000 fires is 2. This indicator was the highest - 8 in 2007, and the lowest 0 in 2003. The trend for deaths per 1,000 fire incidents is declining. Compared to the state value the number of fatalities per 1,000 fires is higher.
According to the reports from the years 2002 - 2018 the average number of fire-related fatalities per year is 1. The highest number of reported deaths - 3 took place in 2007, and the lowest - 0 in 2003. The data has a decreasing trend.
The average number of fatalities per 1,000 fires is 2. This indicator was the highest - 8 in 2007, and the lowest 0 in 2003. The trend for deaths per 1,000 fire incidents is declining. Compared to the state value the number of fatalities per 1,000 fires is higher.Deaths per 1,000 incidents in Salisbury, NC compared to nearest cities:
(Note: Based on data for all years, including only cities with at least 2,500 fire incidents)
| Salisbury: | 1.8 |
| Lexington: | 0.0 |
| Mocksville: | 1.7 |
| Concord: | 0.5 |
| Mooresville: | 0.0 |
| Statesville: | 0.8 |
| Albemarle: | 2.4 |
| Thomasville: | 2.5 |
| Winston-Salem: | 2.1 |
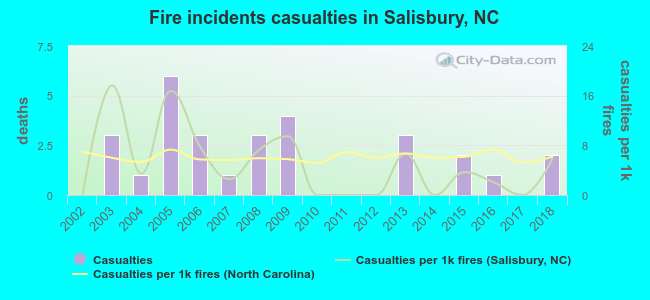 Based on the data from the years 2002 - 2018 the average number of fire-related casualties per year is 2. The highest number of reported casualties - 6 took place in 2005, and the lowest - 0 in 2002. The data has an increasing trend.
The average number of injuries per 1,000 fires is 5. This indicator was the highest - 18 in 2003, and the lowest 0 in 2002. The trend for injuries per 1,000 incidents is rising. Compared to the North Carolina value the number of injuries per 1,000 incidents is lower.
Based on the data from the years 2002 - 2018 the average number of fire-related casualties per year is 2. The highest number of reported casualties - 6 took place in 2005, and the lowest - 0 in 2002. The data has an increasing trend.
The average number of injuries per 1,000 fires is 5. This indicator was the highest - 18 in 2003, and the lowest 0 in 2002. The trend for injuries per 1,000 incidents is rising. Compared to the North Carolina value the number of injuries per 1,000 incidents is lower.Casualties per 1,000 incidents in Salisbury, NC compared to nearest cities:
(Note: Based on data for all years, including only cities with at least 500 fire incidents)
| Salisbury: | 4.6 |
| China Grove: | 0.0 |
| Rockwell: | 0.9 |
| Kannapolis: | 19.0 |
| Lexington: | 2.5 |
| Mocksville: | 5.7 |
| Advance: | 8.9 |
| Concord: | 6.7 |
| Mooresville: | 4.0 |
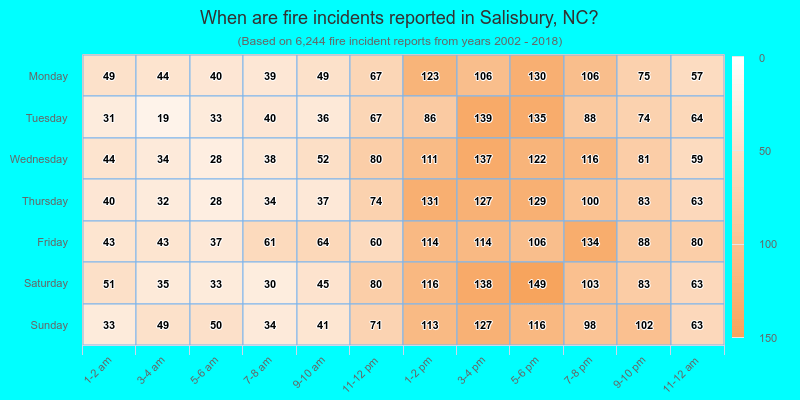
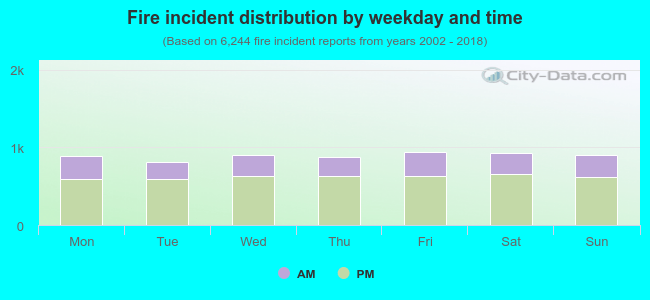 30.3% incidents where reported in the morning and 69.7% in the evening. The most fires (15.1%) took place on Friday, and the least (13.0%) on Tuesday.
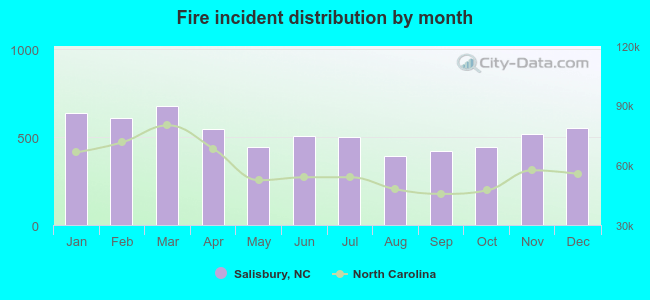 According to the 6,244 fire incident reports from years 2002 - 2018 most fires (10.9%) took place during March, and the least (6.3%) in August.
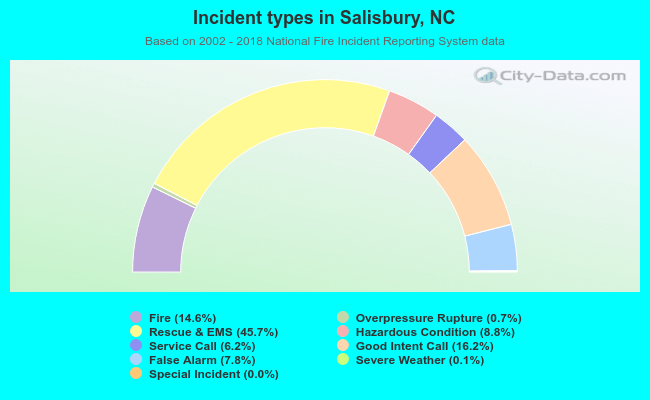 Out of all 42,798 cases reported during the years 2002 - 2018, the most belonged to the categories: Rescue & EMS (45.7%), Good Intent Call (16.2%), and Fire (14.6%).
 When looking into fire subcategories, the most incidents belonged to: Structure Fires (62.4%), and Outside Fires (21.5%).