Albemarle: Fire Incidents, North Carolina (NC)
Where are fire incidents reported in Albemarle, NC
Something went wrong! Please refresh the page.
| Fire incidents reported | |
|---|---|
| Sreet name | Count |
| MAIN ST | 270 |
| FOURTH ST | 228 |
| STONY GAP RD | 122 |
| SECOND ST | 94 |
| US 52 NORTH | 94 |
| FIFTH ST | 74 |
| WOODHAVEN DR | 62 |
| NC 24-27 BYPASS E | 54 |
| SIXTH ST | 54 |
| CONCORD RD | 50 |
| RIDGE ST | 50 |
| ANDERSON RD | 48 |
| NC 2427 BYPASS E | 46 |
| MOSS SPRINGS RD | 44 |
| WOOD ST | 42 |
| LEONARD AVE | 40 |
| YADKIN ST | 40 |
| HEATHWOOD DR | 38 |
| LOWDER ST | 38 |
| ST MARTIN RD | 38 |
| FIRST ST | 36 |
| INGER ST | 36 |
| MORROW MOUNTAIN RD | 36 |
| NC 740 HWY | 36 |
| AREY AVE | 32 |
| AUSTIN ST | 30 |
| DEPOT ST | 30 |
| GIBSON ST | 30 |
| AQUADALE RD | 28 |
| HILL ST | 28 |
| Other | 1,058 |
2002 - 2018 National Fire Incident Reporting System (NFIRS) incidents
- Incident types reported to NFIRS in Albemarle, NC
- 11,60557.7%Rescue & EMS
- 2,90614.5%Fire
- 1,8829.4%Good Intent Call
- 1,6238.1%False Alarm
- 1,3586.8%Hazardous Condition
- 5782.9%Service Call
- 1000.5%Severe Weather
- 270.1%Special Incident
- 210.1%Overpressure Rupture
- Fire incident types reported to NFIRS in Albemarle, NC
- 1,64956.7%Structure Fires
- 77726.7%Outside Fires
- 38913.4%Mobile Property/Vehicle Fires
- 913.1%Other
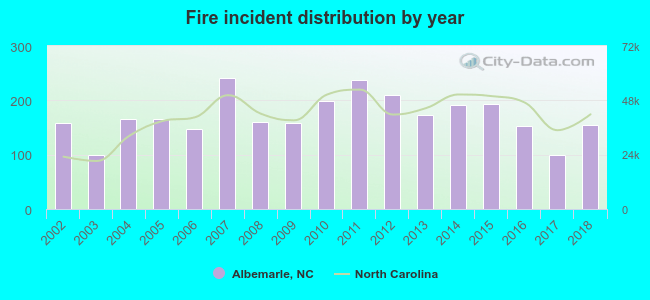 Based on the data from the years 2002 - 2018 the average number of fire incidents per year is 171. The highest number of reported fires - 241 took place in 2007, and the least - 100 in 2003. The data has a dropping trend.
The average number of yearly fire incidents per 10k residents in Albemarle, NC compared to nearest cities:
(Note: Based on data for the last 3 years, including only cities with population 5,000 and above)
| Albemarle: | 84.7 |
| Concord: | 31.7 |
| Kannapolis: | 24.5 |
| Harrisburg: | 21.2 |
| Salisbury: | 116.0 |
| Unionville: | 1.6 |
| Wadesboro: | 86.0 |
| Mint Hill: | 26.7 |
| Lexington: | 172.1 |
 The median response time based on all reported fire incidents is 6 minutes. This is comparable to the state median value.
The median response time in Albemarle, NC compared to nearest cities:
(Note: Based on data for all years, including only cities with at least 500 fire incidents)
| Albemarle: | 6 minutes |
| Troy: | 7 minutes |
| Rockwell: | 8 minutes |
| Denton: | 8 minutes |
| Concord: | 5 minutes |
| Kannapolis: | 5 minutes |
| China Grove: | 8 minutes |
| Salisbury: | 7 minutes |
| Seagrove: | 10 minutes |
 According to the reports from the years 2002 - 2018 the average number of fire-related fatalities per year is 0. The highest number of deaths - 2 took place in 2012, and the lowest - 0 in 2002. The data has a rising trend.
The average number of deaths per 1,000 fires is 2. This indicator was the highest - 10 in 2012, and the lowest 0 in 2002. The trend for deaths per 1,000 fire incidents is increasing. Compared to the state value the number of fatalities per 1,000 fires is higher.
According to the reports from the years 2002 - 2018 the average number of fire-related fatalities per year is 0. The highest number of deaths - 2 took place in 2012, and the lowest - 0 in 2002. The data has a rising trend.
The average number of deaths per 1,000 fires is 2. This indicator was the highest - 10 in 2012, and the lowest 0 in 2002. The trend for deaths per 1,000 fire incidents is increasing. Compared to the state value the number of fatalities per 1,000 fires is higher.Deaths per 1,000 incidents in Albemarle, NC compared to nearest cities:
(Note: Based on data for all years, including only cities with at least 2,500 fire incidents)
| Albemarle: | 2.4 |
| Concord: | 0.5 |
| Salisbury: | 1.8 |
| Lexington: | 0.0 |
| Monroe: | 1.2 |
| Asheboro: | 0.3 |
| Thomasville: | 2.5 |
| Charlotte: | 2.2 |
| Mooresville: | 0.0 |
 Based on the reports from the years 2002 - 2018 the average number of fire-related casualties per year is 3. The highest number of injuries - 11 took place in 2011, and the lowest - 0 in 2009. The data has a dropping trend.
The average number of casualties per 1,000 fires is 18. This indicator was the highest - 46 in 2011, and the lowest 0 in 2009. The trend for injuries per 1,000 fire incidents is decreasing. Compared to the state value the number of casualties per 1,000 fire incidents is much higher.
Based on the reports from the years 2002 - 2018 the average number of fire-related casualties per year is 3. The highest number of injuries - 11 took place in 2011, and the lowest - 0 in 2009. The data has a dropping trend.
The average number of casualties per 1,000 fires is 18. This indicator was the highest - 46 in 2011, and the lowest 0 in 2009. The trend for injuries per 1,000 fire incidents is decreasing. Compared to the state value the number of casualties per 1,000 fire incidents is much higher.Casualties per 1,000 incidents in Albemarle, NC compared to nearest cities:
(Note: Based on data for all years, including only cities with at least 500 fire incidents)
| Albemarle: | 20.0 |
| Troy: | 0.0 |
| Rockwell: | 0.9 |
| Denton: | 0.0 |
| Concord: | 6.7 |
| Kannapolis: | 19.0 |
| China Grove: | 0.0 |
| Salisbury: | 4.6 |
| Seagrove: | 1.5 |
 30.8% incidents where reported in the morning and 69.2% in the evening. The most fires (16.3%) took place on Saturday, and the least (13.4%) on Friday.
 Based on the 2,906 fire incidents from years 2002 - 2018 most fires (9.6%) took place during March, and the least (6.4%) in September.
 Out of all 20,100 cases reported during the years 2002 - 2018, the most belonged to the categories: Rescue & EMS (57.7%), Fire (14.5%), and Good Intent Call (9.4%).
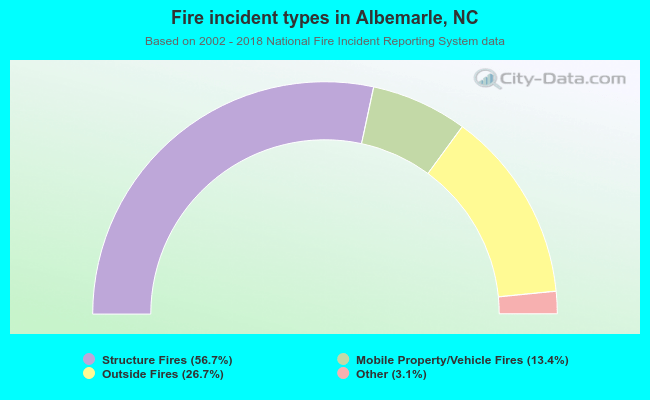 When looking into fire subcategories, the most reports belonged to: Structure Fires (56.7%), and Outside Fires (26.7%).