Hoover: Fire Incidents, Alabama (AL)
Where are fire incidents reported in Hoover, AL
Something went wrong! Please refresh the page.
| Fire incidents reported | |
|---|---|
| Sreet name | Count |
| MONTGOMERY HWY | 228 |
| I65 | 173 |
| JOHN HAWKINS PKY | 173 |
| I459 | 157 |
| LORNA RD | 154 |
| RIME VILLAGE DR | 149 |
| PATTON CHAPEL RD | 121 |
| TREE CROSSING PKY | 111 |
| HIGHWAY 280 | 104 |
| WISTERIA PL | 99 |
| TREELINE CT | 94 |
| HAMPTON PARK DR | 91 |
| SHADES CREST RD | 91 |
| VALLEYDALE RD | 80 |
| RIVERCHASE GALLERIA | 77 |
| ALFORD AVE | 72 |
| TYLER CIR | 58 |
| DOUG BAKER BLVD | 57 |
| ALPINE VILLAGE | 56 |
| GALLERIA CIR | 53 |
| HUCKLEBERRY LN | 53 |
| STADIUM TRCE | 52 |
| RIVERCHASE PKY | 49 |
| OLD COLUMBIANA RD | 47 |
| RIVERHAVEN CIR | 47 |
| CAROUSEL CT | 41 |
| SUMMERCHASE DR | 41 |
| PRESERVE DR | 40 |
| RIDGE MANOR DR | 39 |
| I65SB | 36 |
2003 - 2018 National Fire Incident Reporting System (NFIRS) incidents
- Incident types reported to NFIRS in Hoover, AL
- 9,35556.8%Rescue & EMS
- 1,84811.2%Service Call
- 1,66010.1%Fire
- 1,3047.9%False Alarm
- 1,2827.8%Hazardous Condition
- 8615.2%Good Intent Call
- 1150.7%Severe Weather
- 230.1%Overpressure Rupture
- Fire incident types reported to NFIRS in Hoover, AL
- 70742.6%Outside Fires
- 55733.6%Structure Fires
- 30418.3%Mobile Property/Vehicle Fires
- 925.5%Other
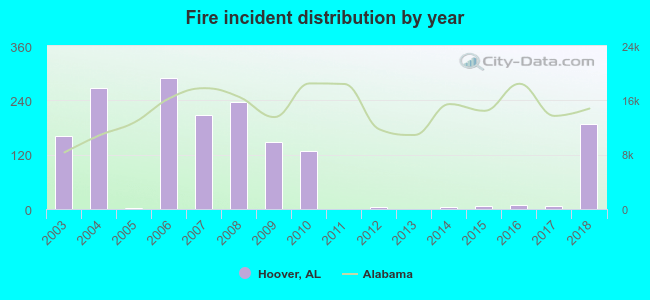 According to the data from the years 2003 - 2018 the average number of fires per year is 104. The highest number of reported fire incidents - 289 took place in 2006, and the least - 0 in 2011. The data has a growing trend.
The average number of yearly fire incidents per 10k residents in Hoover, AL compared to nearest cities:
(Note: Based on data for the last 3 years, including only cities with population 5,000 and above)
| Hoover: | 8.0 |
| Vestavia Hills: | 20.2 |
| Homewood: | 35.3 |
| Pelham: | 33.9 |
| Mountain Brook: | 11.4 |
| Helena: | 3.4 |
| Midfield: | 63.3 |
| Bessemer: | 92.8 |
| Fairfield: | 8.2 |
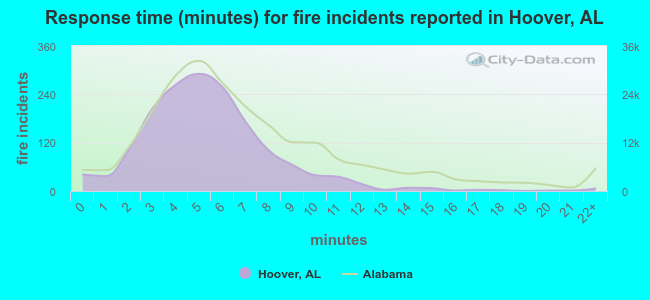 The median response time based on all reported fire incidents is 5 minutes. This is lower than the Alabama median value.
The median response time in Hoover, AL compared to nearest cities:
(Note: Based on data for all years, including only cities with at least 500 fire incidents)
| Hoover: | 5 minutes |
| Vestavia Hills: | 4 minutes |
| Homewood: | 6 minutes |
| Pelham: | 5 minutes |
| Midfield: | 5 minutes |
| Bessemer: | 5 minutes |
| Birmingham: | 6 minutes |
| Alabaster: | 6 minutes |
| Pleasant Grove: | 4 minutes |
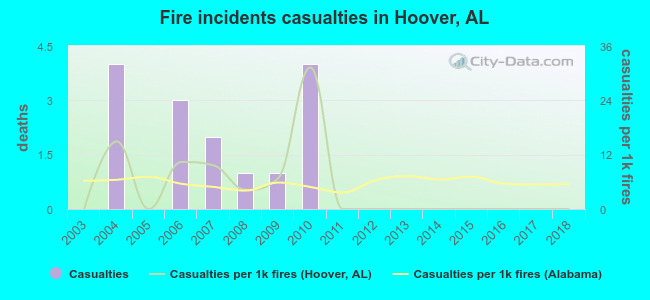 According to the reports from the years 2003 - 2018 the average number of fire-related casualties per year is 1. The highest number of casualties - 4 took place in 2004, and the lowest - 0 in 2003. The data has a constant trend.
The average number of injuries per 1,000 fire incidents is 5. This indicator was the highest - 31 in 2010, and the lowest 0 in 2003. The trend for injuries per 1,000 fire incidents is constant. Compared to the Alabama value the number of casualties per 1,000 fire incidents is higher.
According to the reports from the years 2003 - 2018 the average number of fire-related casualties per year is 1. The highest number of casualties - 4 took place in 2004, and the lowest - 0 in 2003. The data has a constant trend.
The average number of injuries per 1,000 fire incidents is 5. This indicator was the highest - 31 in 2010, and the lowest 0 in 2003. The trend for injuries per 1,000 fire incidents is constant. Compared to the Alabama value the number of casualties per 1,000 fire incidents is higher.Casualties per 1,000 incidents in Hoover, AL compared to nearest cities:
(Note: Based on data for all years, including only cities with at least 500 fire incidents)
| Hoover: | 9.0 |
| Vestavia Hills: | 19.5 |
| Homewood: | 3.9 |
| Pelham: | 8.8 |
| Midfield: | 0.0 |
| Bessemer: | 5.0 |
| Birmingham: | 5.1 |
| Alabaster: | 14.4 |
| Pleasant Grove: | 5.3 |
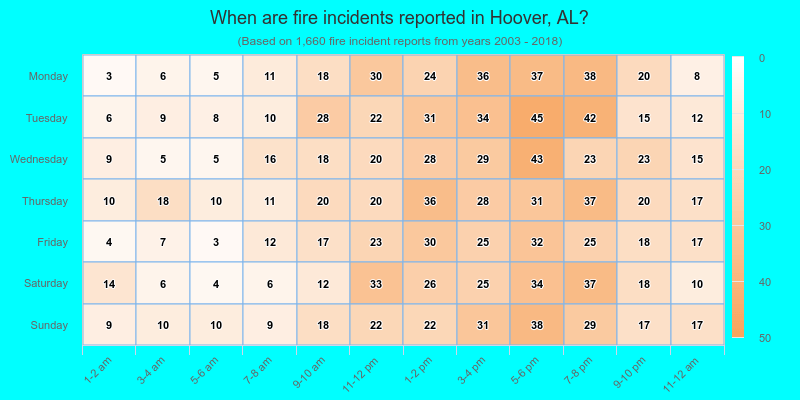
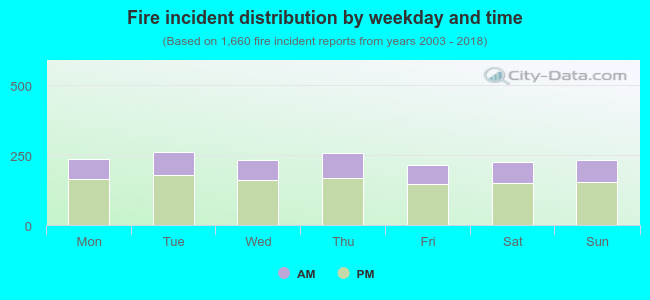 32.3% incidents where reported in the morning and 67.7% in the evening. The most fires (15.8%) took place on Tuesday, and the least (12.8%) on Friday.
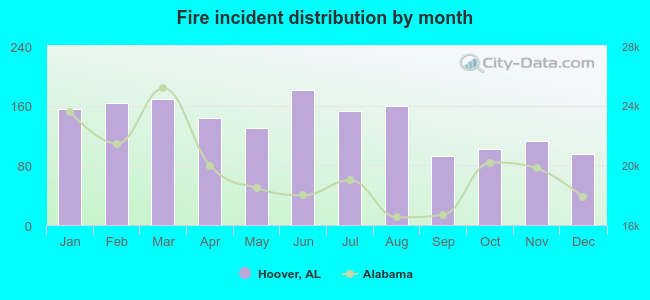 Based on the 1,660 incident reports from years 2003 - 2018 most fires (10.9%) took place during June, and the least (5.6%) in September.
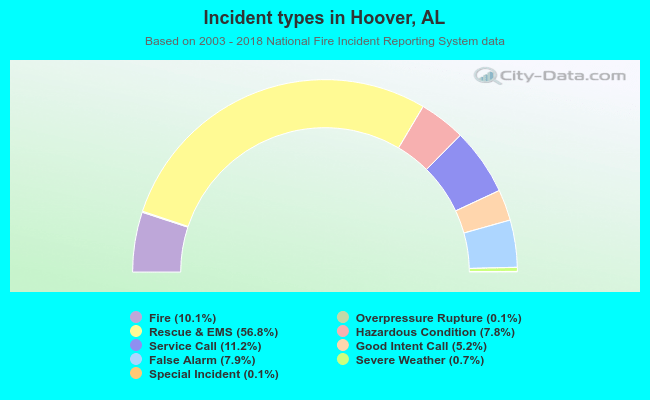 Out of all 16,460 cases reported during the years 2003 - 2018, the most belonged to the categories: Rescue & EMS (56.8%), Service Call (11.2%), and Fire (10.1%).
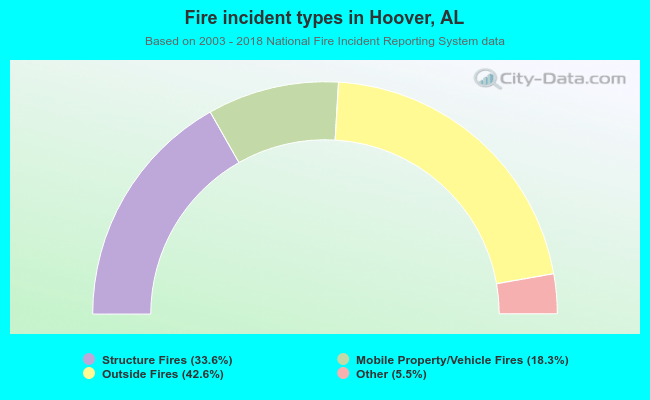 When looking into fire subcategories, the most incidents belonged to: Outside Fires (42.6%), and Structure Fires (33.6%).