Birmingham: Fire Incidents, Alabama (AL)
Where are fire incidents reported in Birmingham, AL
Something went wrong! Please refresh the page.
| Fire incidents reported | |
|---|---|
| Sreet name | Count |
| 1ST AVE | 1,963 |
| 3RD AVE | 1,546 |
| 5TH AVE | 1,328 |
| 2ND AVE | 1,114 |
| 4TH AVE | 1,106 |
| 6TH AVE | 913 |
| TUSCALOOSA AVE | 878 |
| INTERSTATE 59 N | 756 |
| INTERSTATE 59 | 735 |
| 9TH AVE | 708 |
| 8TH AVE | 695 |
| 14TH AVE | 611 |
| INTERSTATE 59 S | 568 |
| JEFFERSON AVE | 566 |
| 7TH AVE | 555 |
| 20TH ST | 554 |
| 10TH AVE | 551 |
| 6TH ST | 538 |
| PARKWAY EAST | 528 |
| 12TH AVE | 524 |
| CARSON RD | 521 |
| BESSEMER RD | 513 |
| 19TH ST | 508 |
| 1ST ST | 496 |
| AVENUE E | 486 |
| FORESTDALE BLVD | 485 |
| 280 HWY | 482 |
| PINSON VALLEY PKY | 473 |
| 2ND ST | 471 |
| 3RD ST | 467 |
| Other | 7,621 |
2002 - 2018 National Fire Incident Reporting System (NFIRS) incidents
- Incident types reported to NFIRS in Birmingham, AL
- 202,13560.6%Rescue & EMS
- 43,84513.1%Good Intent Call
- 29,2608.8%Fire
- 27,2668.2%Service Call
- 19,6415.9%False Alarm
- 10,1403.0%Hazardous Condition
- 8710.3%Special Incident
- Fire incident types reported to NFIRS in Birmingham, AL
- 12,38142.3%Structure Fires
- 9,24431.6%Outside Fires
- 6,43822.0%Mobile Property/Vehicle Fires
- 1,1974.1%Other
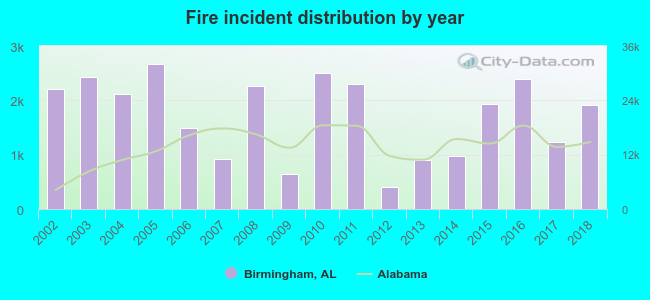 Based on the data from the years 2002 - 2018 the average number of fires per year is 1,721. The highest number of fire incidents - 2,660 took place in 2005, and the least - 396 in 2012. The data has a declining trend.
The average number of yearly fire incidents per 10k residents in Birmingham, AL compared to nearest cities:
(Note: Based on data for the last 3 years, including only cities with population 5,000 and above)
| Birmingham: | 87.0 |
| Homewood: | 35.3 |
| Mountain Brook: | 11.4 |
| Tarrant: | 58.6 |
| Fultondale: | 48.3 |
| Vestavia Hills: | 20.2 |
| Fairfield: | 8.2 |
| Irondale: | 55.7 |
| Midfield: | 63.3 |
 The median response time based on all reported fire incidents is 6 minutes. This is close to the Alabama median value.
The median response time in Birmingham, AL compared to nearest cities:
(Note: Based on data for all years, including only cities with at least 500 fire incidents)
| Birmingham: | 6 minutes |
| Homewood: | 6 minutes |
| Tarrant: | 3 minutes |
| Vestavia Hills: | 4 minutes |
| Irondale: | 5 minutes |
| Midfield: | 5 minutes |
| Adamsville: | 5 minutes |
| Pleasant Grove: | 4 minutes |
| Hoover: | 5 minutes |
 Based on the data from the years 2002 - 2018 the average number of fire-related fatalities per year is 4. The highest number of reported deaths - 15 took place in 2016, and the lowest - 0 in 2002. The data has a growing trend.
The average number of fatalities per 1,000 fire incidents is 3. This indicator was the highest - 9 in 2013, and the lowest 0 in 2002. The trend for deaths per 1,000 incidents is growing. Compared to the state value the number of fatalities per 1,000 fire incidents is about the same.
Based on the data from the years 2002 - 2018 the average number of fire-related fatalities per year is 4. The highest number of reported deaths - 15 took place in 2016, and the lowest - 0 in 2002. The data has a growing trend.
The average number of fatalities per 1,000 fire incidents is 3. This indicator was the highest - 9 in 2013, and the lowest 0 in 2002. The trend for deaths per 1,000 incidents is growing. Compared to the state value the number of fatalities per 1,000 fire incidents is about the same.Deaths per 1,000 incidents in Birmingham, AL compared to nearest cities:
(Note: Based on data for all years, including only cities with at least 2,500 fire incidents)
| Birmingham: | 2.5 |
| Bessemer: | 2.0 |
 Based on the reports from the years 2002 - 2018 the average number of fire-related yearly casualties is 9. The highest number of injuries - 16 took place in 2015, and the lowest - 1 in 2005. The data has an increasing trend.
The average number of casualties per 1,000 fires is 7. This indicator was the highest - 19 in 2009, and the lowest 0 in 2005. The trend for injuries per 1,000 incidents is rising. Compared to the state value the number of casualties per 1,000 fire incidents is about the same.
Based on the reports from the years 2002 - 2018 the average number of fire-related yearly casualties is 9. The highest number of injuries - 16 took place in 2015, and the lowest - 1 in 2005. The data has an increasing trend.
The average number of casualties per 1,000 fires is 7. This indicator was the highest - 19 in 2009, and the lowest 0 in 2005. The trend for injuries per 1,000 incidents is rising. Compared to the state value the number of casualties per 1,000 fire incidents is about the same.Casualties per 1,000 incidents in Birmingham, AL compared to nearest cities:
(Note: Based on data for all years, including only cities with at least 500 fire incidents)
| Birmingham: | 5.1 |
| Homewood: | 3.9 |
| Tarrant: | 3.9 |
| Vestavia Hills: | 19.5 |
| Irondale: | 13.6 |
| Midfield: | 0.0 |
| Adamsville: | 15.6 |
| Pleasant Grove: | 5.3 |
| Hoover: | 9.0 |
 35.9% incidents where reported in the morning and 64.1% in the evening. The most fires (15.3%) took place on Sunday, and the least (13.4%) on Wednesday.
 Based on the 29,260 reports from years 2002 - 2018 most fires (9.3%) took place during July, and the least (6.5%) in February.
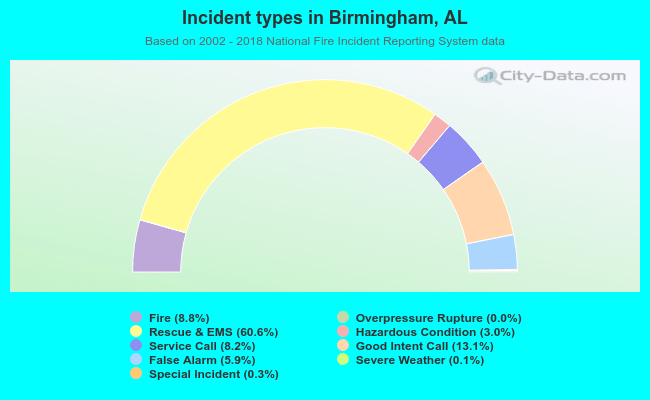 Out of all 333,556 cases reported during the years 2002 - 2018, the most belonged to the categories: Rescue & EMS (60.6%), Good Intent Call (13.1%), and Fire (8.8%).
 When looking into fire subcategories, the most reports belonged to: Structure Fires (42.3%), and Outside Fires (31.6%).