Bessemer: Fire Incidents, Alabama (AL)
Where are fire incidents reported in Bessemer, AL
Something went wrong! Please refresh the page.
| Fire incidents reported | |
|---|---|
| Sreet name | Count |
| 9TH AVE | 688 |
| I-59 | 458 |
| I2059 | 435 |
| FAIRFAX AVE | 366 |
| MORGAN RD | 320 |
| LOCK 17 RD | 315 |
| 4TH AVE | 295 |
| 19TH ST | 293 |
| 5TH AVE | 287 |
| DARTMOUTH AVE | 285 |
| EXETER AVE | 265 |
| WARRIOR RIVER RD | 248 |
| 6TH AVE | 242 |
| FLINT HILL RD | 239 |
| BERKLEY AVE | 217 |
| 8TH AVE | 211 |
| I-459 | 210 |
| ACADEMY DR | 205 |
| 2ND AVE | 202 |
| 7TH AVE | 200 |
| 10TH AVE | 198 |
| 15TH ST | 186 |
| 1ST AVE | 178 |
| ARLINGTON AVE | 174 |
| CLARENDON AVE | 174 |
| 20TH ST | 169 |
| GRANVILLE AVE | 166 |
| I459 | 165 |
| 16TH ST | 162 |
| 3RD AVE | 153 |
2004 - 2018 National Fire Incident Reporting System (NFIRS) incidents
- Incident types reported to NFIRS in Bessemer, AL
- 18,94760.0%Rescue & EMS
- 4,59614.6%Fire
- 2,2397.1%Service Call
- 1,9596.2%Good Intent Call
- 1,8775.9%False Alarm
- 1,7975.7%Hazardous Condition
- 1060.3%Special Incident
- Fire incident types reported to NFIRS in Bessemer, AL
- 1,89441.2%Outside Fires
- 1,56534.1%Structure Fires
- 1,02222.2%Mobile Property/Vehicle Fires
- 1152.5%Other
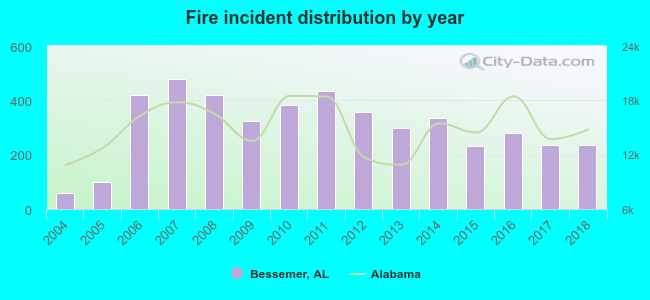 Based on the data from the years 2004 - 2018 the average number of fires per year is 306. The highest number of fire incidents - 479 took place in 2007, and the least - 59 in 2004. The data has a rising trend.
The average number of yearly fire incidents per 10k residents in Bessemer, AL compared to nearest cities:
(Note: Based on data for the last 3 years, including only cities with population 5,000 and above)
| Bessemer: | 92.8 |
| Hueytown: | 27.8 |
| Midfield: | 63.3 |
| Fairfield: | 8.2 |
| Pleasant Grove: | 30.3 |
| Hoover: | 8.0 |
| Helena: | 3.4 |
| Homewood: | 35.3 |
| Vestavia Hills: | 20.2 |
 The median response time based on all reported fire incidents is 5 minutes. This is lower than the Alabama median value.
The median response time in Bessemer, AL compared to nearest cities:
(Note: Based on data for all years, including only cities with at least 500 fire incidents)
| Bessemer: | 5 minutes |
| Midfield: | 5 minutes |
| Pleasant Grove: | 4 minutes |
| Hoover: | 5 minutes |
| Homewood: | 6 minutes |
| Vestavia Hills: | 4 minutes |
| Pelham: | 5 minutes |
| Birmingham: | 6 minutes |
| Alabaster: | 6 minutes |
 Based on the data from the years 2004 - 2018 the average number of fire-related fatalities per year is 1. The highest number of reported deaths - 2 took place in 2007, and the lowest - 0 in 2004. The data has a constant trend.
The average number of deaths per 1,000 fire incidents is 2. This indicator was the highest - 9 in 2017, and the lowest 0 in 2004. The trend for fatalities per 1,000 fire incidents is constant. Compared to the state value the number of fatalities per 1,000 fire incidents is similar.
Based on the data from the years 2004 - 2018 the average number of fire-related fatalities per year is 1. The highest number of reported deaths - 2 took place in 2007, and the lowest - 0 in 2004. The data has a constant trend.
The average number of deaths per 1,000 fire incidents is 2. This indicator was the highest - 9 in 2017, and the lowest 0 in 2004. The trend for fatalities per 1,000 fire incidents is constant. Compared to the state value the number of fatalities per 1,000 fire incidents is similar.Deaths per 1,000 incidents in Bessemer, AL compared to nearest cities:
(Note: Based on data for all years, including only cities with at least 2,500 fire incidents)
| Bessemer: | 2.0 |
| Birmingham: | 2.5 |
 According to the data from the years 2004 - 2018 the average number of fire-related casualties per year is 2. The highest number of casualties - 6 took place in 2007, and the lowest - 0 in 2014. The data has a constant trend.
The average number of injuries per 1,000 fire incidents is 6. This indicator was the highest - 20 in 2005, and the lowest 0 in 2014. The trend for casualties per 1,000 incidents is declining. Compared to the state value the number of injuries per 1,000 incidents is similar.
According to the data from the years 2004 - 2018 the average number of fire-related casualties per year is 2. The highest number of casualties - 6 took place in 2007, and the lowest - 0 in 2014. The data has a constant trend.
The average number of injuries per 1,000 fire incidents is 6. This indicator was the highest - 20 in 2005, and the lowest 0 in 2014. The trend for casualties per 1,000 incidents is declining. Compared to the state value the number of injuries per 1,000 incidents is similar.Casualties per 1,000 incidents in Bessemer, AL compared to nearest cities:
(Note: Based on data for all years, including only cities with at least 500 fire incidents)
| Bessemer: | 5.0 |
| Midfield: | 0.0 |
| Pleasant Grove: | 5.3 |
| Hoover: | 9.0 |
| Homewood: | 3.9 |
| Vestavia Hills: | 19.5 |
| Pelham: | 8.8 |
| Birmingham: | 5.1 |
| Alabaster: | 14.4 |
 34.9% incidents where reported in the morning and 65.1% in the evening. The most fires (15.1%) took place on Saturday, and the least (13.4%) on Tuesday.
 According to the 4,596 incident reports from years 2004 - 2018 most fires (9.2%) took place during June, and the least (6.9%) in August.
 Out of all 31,557 cases reported during the years 2004 - 2018, the most belonged to the categories: Rescue & EMS (60.0%), Fire (14.6%), and Service Call (7.1%).
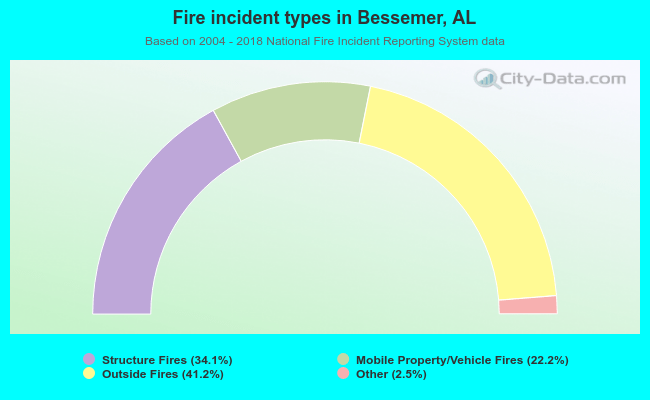 When looking into fire subcategories, the most incidents belonged to: Outside Fires (41.2%), and Structure Fires (34.1%).