Alabaster: Fire Incidents, Alabama (AL)
Where are fire incidents reported in Alabaster, AL
Something went wrong! Please refresh the page.
| Fire incidents reported | |
|---|---|
| Sreet name | Count |
| INTERSTATE 65 | 354 |
| HWY 119 | 211 |
| SIMMSVILLE ROAD | 144 |
| 1ST STREET NORTH | 109 |
| HWY 17 | 107 |
| HWY 31 | 105 |
| KENT DAIRY ROAD | 85 |
| 1ST ST | 72 |
| 1ST AVENUE WEST | 69 |
| 5TH AVENUE SE | 61 |
| SIMMSVILLE RD | 60 |
| COLONIAL PROMENADE PKWY | 56 |
| OLD HWY 31 | 56 |
| WINDSOR CT | 50 |
| COHILL DRIVE | 47 |
| 1ST STREET SOUTH | 46 |
| SMOKEY ROAD | 46 |
| 5TH AVE | 45 |
| GOLDWIRE CIRCLE | 44 |
| THOMPSON ROAD | 40 |
| FULTON SPRINGS ROAD | 38 |
| WARRIOR DRIVE | 37 |
| WINDSOR COURT | 37 |
| 11TH AVENUE SE | 36 |
| 1ST STREET SW | 35 |
| INTERSTATE 65 FWY | 35 |
| KENT DAIRY RD | 35 |
| MISSION HILLS ROAD | 34 |
| KENTWOOD DRIVE | 33 |
| WOODBROOK CIRCLE | 33 |
2003 - 2018 National Fire Incident Reporting System (NFIRS) incidents
- Incident types reported to NFIRS in Alabaster, AL
- 8,49956.5%Rescue & EMS
- 1,81312.0%Service Call
- 1,4639.7%Good Intent Call
- 1,3879.2%Fire
- 1,0917.3%Hazardous Condition
- 7455.0%False Alarm
- 180.1%Severe Weather
- 170.1%Overpressure Rupture
- Fire incident types reported to NFIRS in Alabaster, AL
- 59242.7%Outside Fires
- 52137.6%Structure Fires
- 23216.7%Mobile Property/Vehicle Fires
- 423.0%Other
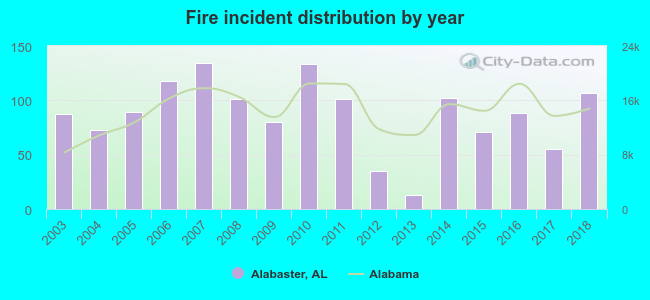 Based on the data from the years 2003 - 2018 the average number of fires per year is 87. The highest number of reported fire incidents - 134 took place in 2007, and the least - 13 in 2013. The data has a growing trend.
The average number of yearly fire incidents per 10k residents in Alabaster, AL compared to nearest cities:
(Note: Based on data for the last 3 years, including only cities with population 5,000 and above)
| Alabaster: | 26.4 |
| Helena: | 3.4 |
| Pelham: | 33.9 |
| Montevallo: | 41.9 |
| Calera: | 45.0 |
| Hoover: | 8.0 |
| Chelsea: | 40.3 |
| Bessemer: | 92.8 |
| Vestavia Hills: | 20.2 |
 The median response time based on all reported fire incidents is 6 minutes. This is about the same as the state median value.
The median response time in Alabaster, AL compared to nearest cities:
(Note: Based on data for all years, including only cities with at least 500 fire incidents)
| Alabaster: | 6 minutes |
| Pelham: | 5 minutes |
| Calera: | 6 minutes |
| Hoover: | 5 minutes |
| Bessemer: | 5 minutes |
| Vestavia Hills: | 4 minutes |
| Homewood: | 6 minutes |
| Midfield: | 5 minutes |
| Jemison: | 10 minutes |
 Based on the data from the years 2003 - 2018 the average number of fire-related casualties per year is 1. The highest number of casualties - 6 took place in 2010, and the lowest - 0 in 2005. The data has a decreasing trend.
The average number of injuries per 1,000 fires is 13. This indicator was the highest - 46 in 2003, and the lowest 0 in 2005. The trend for casualties per 1,000 fire incidents is dropping. Compared to the Alabama value the number of casualties per 1,000 fires is much higher.
Based on the data from the years 2003 - 2018 the average number of fire-related casualties per year is 1. The highest number of casualties - 6 took place in 2010, and the lowest - 0 in 2005. The data has a decreasing trend.
The average number of injuries per 1,000 fires is 13. This indicator was the highest - 46 in 2003, and the lowest 0 in 2005. The trend for casualties per 1,000 fire incidents is dropping. Compared to the Alabama value the number of casualties per 1,000 fires is much higher.
 26.7% incidents where reported in the morning and 73.3% in the evening. The most fires (15.5%) took place on Thursday, and the least (13.0%) on Saturday.
 Based on the 1,387 fire incidents from years 2003 - 2018 most fires (11.2%) took place during January, and the least (6.4%) in February.
 Out of all 15,046 cases reported during the years 2003 - 2018, the most belonged to the categories: Rescue & EMS (56.5%), Service Call (12.0%), and Good Intent Call (9.7%).
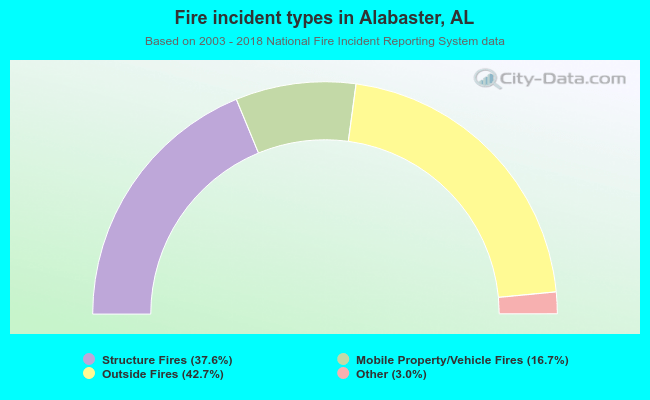 When looking into fire subcategories, the most reports belonged to: Outside Fires (42.7%), and Structure Fires (37.6%).