Tarrant: Fire Incidents, Alabama (AL)
Where are fire incidents reported in Tarrant, AL
Something went wrong! Please refresh the page.
|
| |||||||||||||||||||||||||||||||||||||||||||||||||||||||||||||||||||||||||||||||||||||||||||||||||||||||||||||
2004 - 2018 National Fire Incident Reporting System (NFIRS) incidents
- Incident types reported to NFIRS in Tarrant, AL
- 2,16060.8%Rescue & EMS
- 51214.4%Fire
- 44012.4%Service Call
- 1444.1%Good Intent Call
- 1414.0%False Alarm
- 1393.9%Hazardous Condition
- 140.4%Special Incident
- Fire incident types reported to NFIRS in Tarrant, AL
- 17834.8%Structure Fires
- 17434.0%Outside Fires
- 10720.9%Mobile Property/Vehicle Fires
- 5310.4%Other
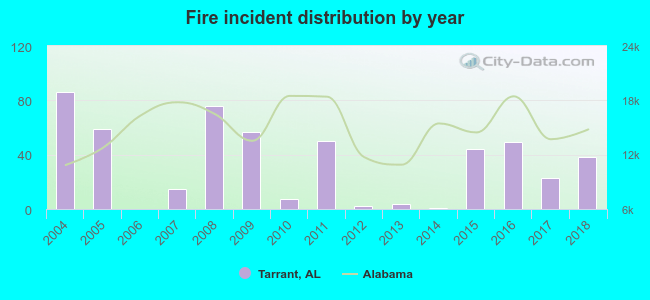 According to the data from the years 2004 - 2018 the average number of fires per year is 34. The highest number of reported fires - 86 took place in 2004, and the least - 0 in 2006. The data has a decreasing trend.
The average number of yearly fire incidents per 10k residents in Tarrant, AL compared to nearest cities:
(Note: Based on data for the last 3 years, including only cities with population 5,000 and above)
| Tarrant: | 58.6 |
| Fultondale: | 48.3 |
| Birmingham: | 87.0 |
| Gardendale: | 48.3 |
| Irondale: | 55.7 |
| Center Point: | 49.5 |
| Mountain Brook: | 11.4 |
| Pinson: | 104.1 |
| Homewood: | 35.3 |
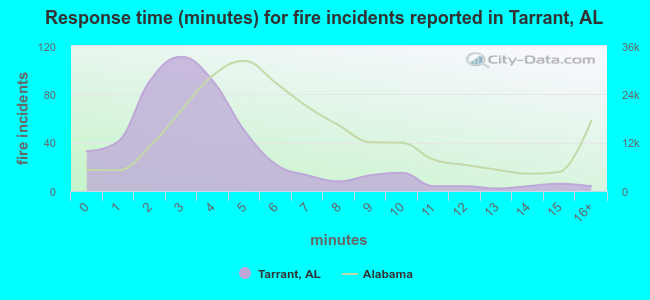 The median response time based on all reported fire incidents is 3 minutes. This is much lower compared to the state median value.
The median response time in Tarrant, AL compared to nearest cities:
(Note: Based on data for all years, including only cities with at least 500 fire incidents)
| Tarrant: | 3 minutes |
| Birmingham: | 6 minutes |
| Irondale: | 5 minutes |
| Pinson: | 6 minutes |
| Homewood: | 6 minutes |
| Trussville: | 7 minutes |
| Adamsville: | 5 minutes |
| Vestavia Hills: | 4 minutes |
| Leeds: | 5 minutes |
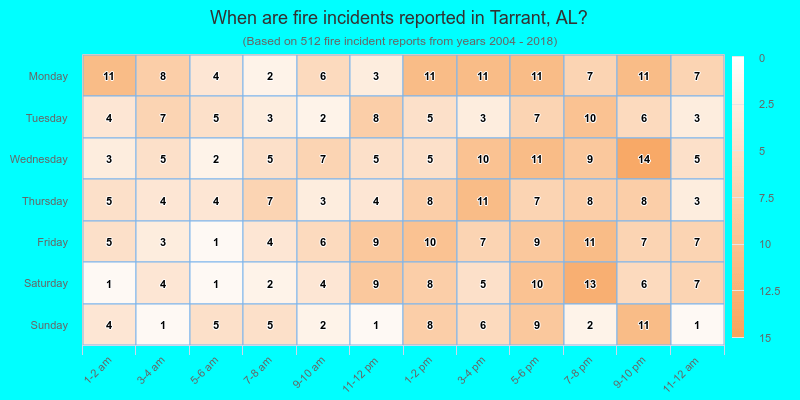
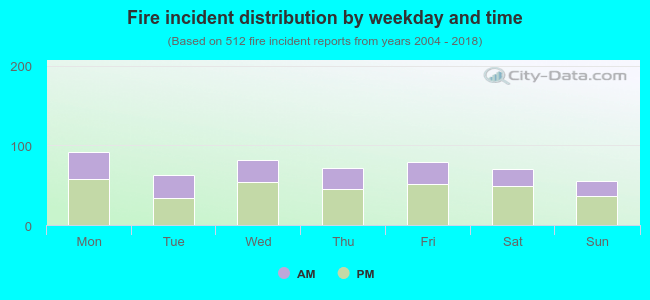 35.9% incidents where reported in the morning and 64.1% in the evening. The most fires (18.0%) took place on Monday, and the least (10.7%) on Sunday.
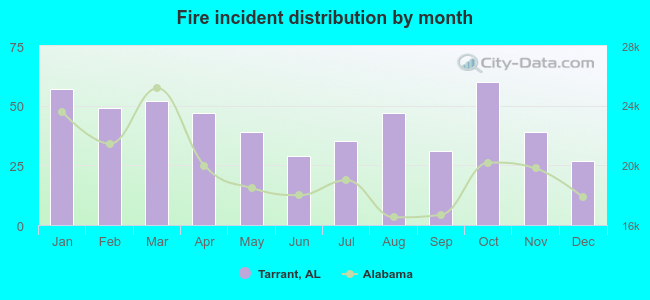 Based on the 512 incident reports from years 2004 - 2018 most fires (11.7%) took place during October, and the least (5.3%) in December.
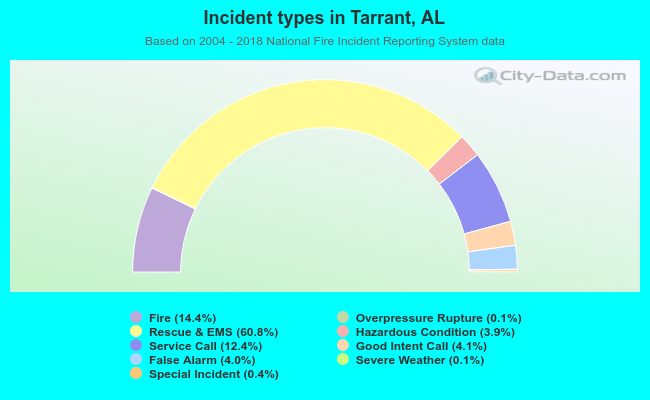 Out of all 3,555 cases reported during the years 2004 - 2018, the most belonged to the categories: Rescue & EMS (60.8%), Fire (14.4%), and Service Call (12.4%).
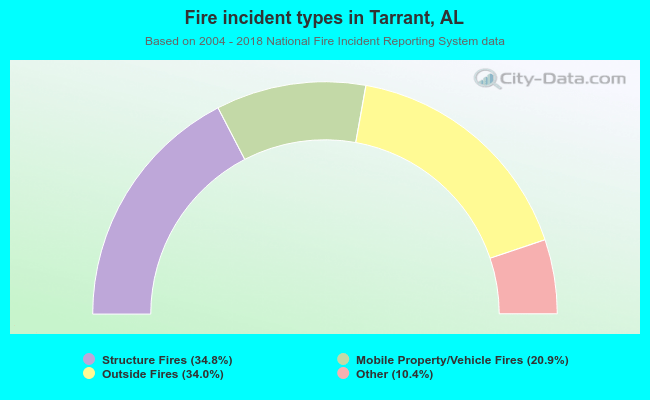 When looking into fire subcategories, the most reports belonged to: Structure Fires (34.8%), and Outside Fires (34.0%).