Center Point: Fire Incidents, Alabama (AL)
Where are fire incidents reported in Center Point, AL
Something went wrong! Please refresh the page.
|
| |||||||||||||||||||||||||||||||||||||||||||||||||||||||||||||||||||||||||||||||||||||||||||||||||||||||||||||
2004 - 2018 National Fire Incident Reporting System (NFIRS) incidents
- Incident types reported to NFIRS in Center Point, AL
- 5,38064.4%Rescue & EMS
- 1,34216.1%Service Call
- 4945.9%Good Intent Call
- 4685.6%False Alarm
- 4365.2%Fire
- 2132.5%Hazardous Condition
- 120.1%Overpressure Rupture
- 120.1%Severe Weather
- Fire incident types reported to NFIRS in Center Point, AL
- 20947.9%Structure Fires
- 15435.3%Outside Fires
- 6915.8%Mobile Property/Vehicle Fires
- 40.9%Other
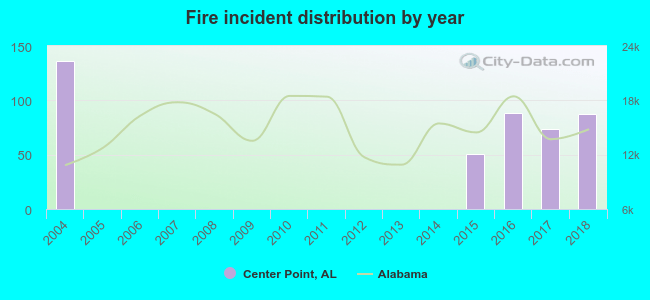 According to the data from the years 2004 - 2018 the average number of fire incidents per year is 29. The highest number of reported fires - 136 took place in 2004, and the least - 0 in 2005. The data has a declining trend.
The average number of yearly fire incidents per 10k residents in Center Point, AL compared to nearest cities:
(Note: Based on data for the last 3 years, including only cities with population 5,000 and above)
| Center Point: | 49.5 |
| Pinson: | 104.1 |
| Trussville: | 18.4 |
| Clay: | 5.2 |
| Tarrant: | 58.6 |
| Fultondale: | 48.3 |
| Irondale: | 55.7 |
| Gardendale: | 48.3 |
| Leeds: | 53.0 |

 Based on the reports from the years 2004 - 2018 the average number of fire-related yearly casualties is 1. The highest number of casualties - 5 took place in 2016, and the lowest - 0 in 2005. The data has a rising trend.
 31.4% incidents where reported in the morning and 68.6% in the evening. The most fires (16.5%) took place on Saturday, and the least (12.6%) on Friday.
 Based on the 436 fire incident reports from years 2004 - 2018 most fires (11.9%) took place during July, and the least (6.2%) in October.
 Out of all 8,359 cases reported during the years 2004 - 2018, the most belonged to the categories: Rescue & EMS (64.4%), Service Call (16.1%), and Good Intent Call (5.9%).
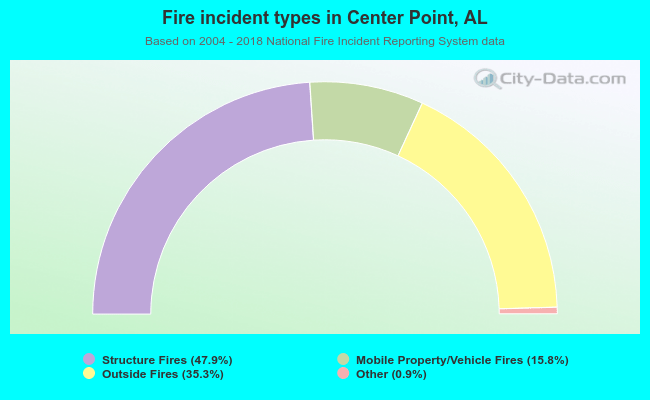 When looking into fire subcategories, the most incidents belonged to: Structure Fires (47.9%), and Outside Fires (35.3%).