Edison: Fire Incidents, New Jersey (NJ)
Where are fire incidents reported in Edison, NJ
Something went wrong! Please refresh the page.
|
| |||||||||||||||||||||||||||||||||||||||||||||||||||||||||||||||||||||||||||||||||||||||||||||||||||||||||||||
2004 - 2018 National Fire Incident Reporting System (NFIRS) incidents
- Incident types reported to NFIRS in Edison, NJ
- 57423.9%False Alarm
- 54222.6%Hazardous Condition
- 39616.5%Fire
- 33113.8%Service Call
- 30912.9%Rescue & EMS
- 2389.9%Good Intent Call
- 70.3%Special Incident
- Fire incident types reported to NFIRS in Edison, NJ
- 18246.0%Outside Fires
- 14937.6%Structure Fires
- 5413.6%Mobile Property/Vehicle Fires
- 112.8%Other
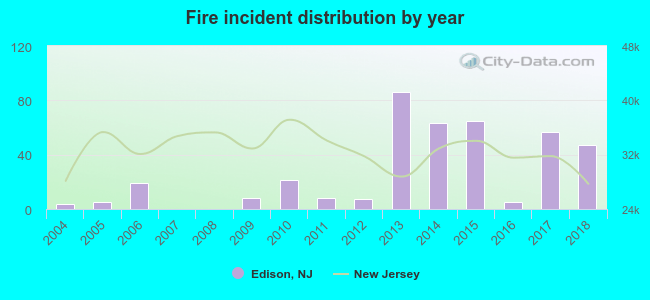 According to the data from the years 2004 - 2018 the average number of fire incidents per year is 26. The highest number of reported fire incidents - 86 took place in 2013, and the least - 0 in 2007. The data has a rising trend.
The average number of yearly fire incidents per 10k residents in Edison, NJ compared to nearest cities:
(Note: Based on data for the last 3 years, including only cities with population 5,000 and above)
| Edison: | 3.6 |
| Metuchen: | 13.7 |
| Fords: | 1.1 |
| South Plainfield: | 48.3 |
| Highland Park: | 19.4 |
| Iselin: | 22.5 |
| Colonia: | 16.5 |
| New Brunswick: | 21.3 |
| Woodbridge: | 34.1 |

 24.0% incidents where reported in the morning and 76.0% in the evening. The most fires (16.2%) took place on Friday, and the least (10.9%) on Sunday.
 Based on the 396 incident reports from years 2004 - 2018 most fires (13.6%) took place during April, and the least (4.3%) in February.
 Out of all 2,400 cases reported during the years 2004 - 2018, the most belonged to the categories: False Alarm (23.9%), Hazardous Condition (22.6%), and Fire (16.5%).
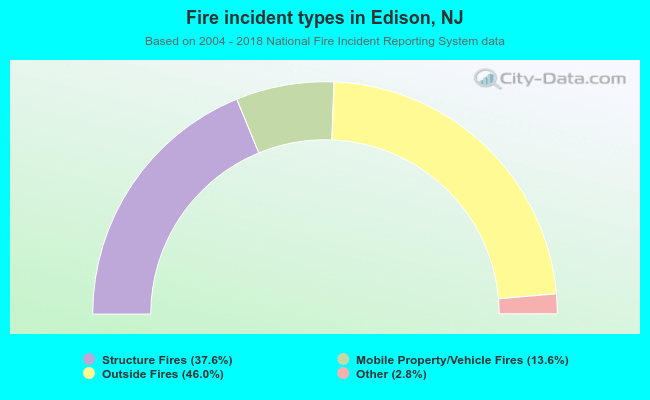 When looking into fire subcategories, the most reports belonged to: Outside Fires (46.0%), and Structure Fires (37.6%).